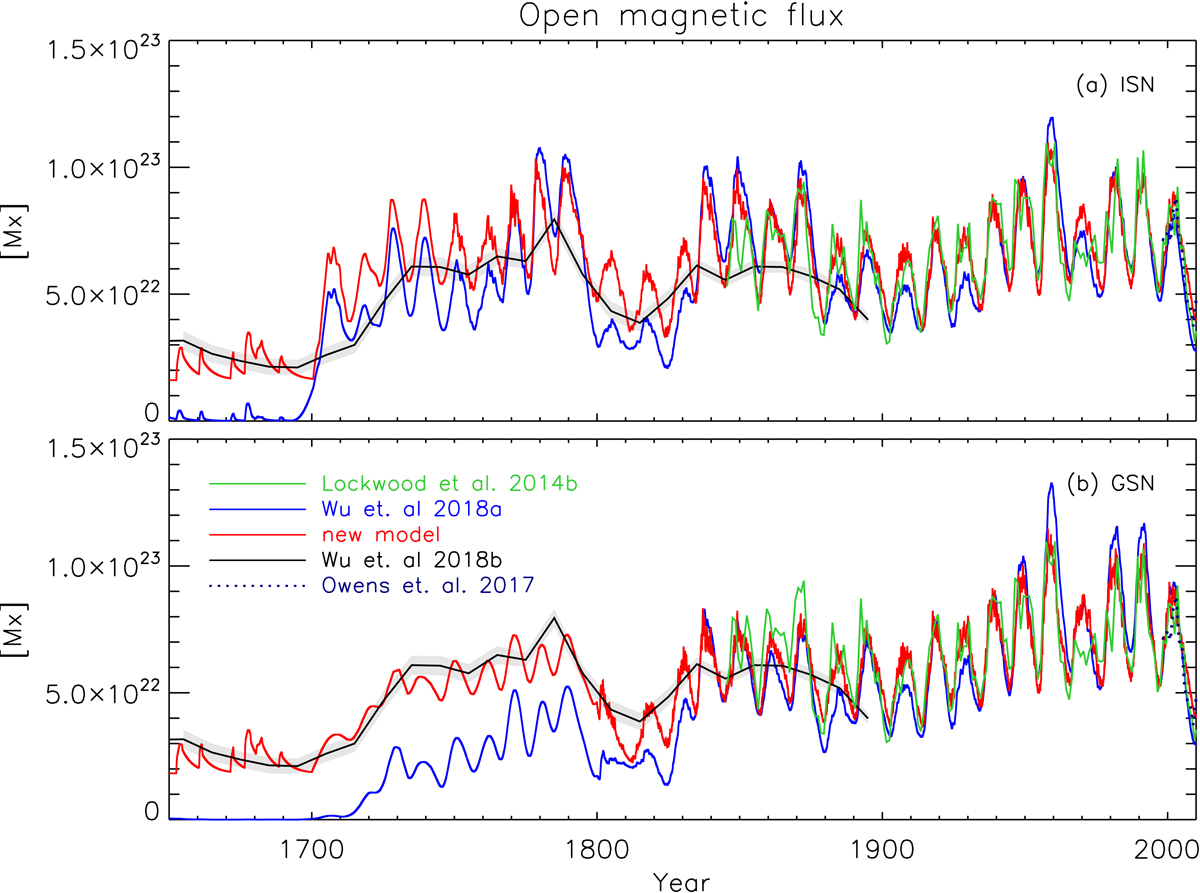
Fig. 4.

Open magnetic flux computed with the new (red) and old (blue) models, together with the empirical reconstruction from the geomagnetic aa-index (Lockwood et al. 2014, green). Also shown are the reconstruction by Wu et al. (2018b, green) from the decadal INTCAL13 14C data (Reimer et al. 2013) and the in situ measurements from Owens et al. (2017, dotted blue line) since 1998. Panels a,b: use ISN and GSN as input, respectively.
Current usage metrics show cumulative count of Article Views (full-text article views including HTML views, PDF and ePub downloads, according to the available data) and Abstracts Views on Vision4Press platform.
Data correspond to usage on the plateform after 2015. The current usage metrics is available 48-96 hours after online publication and is updated daily on week days.
Initial download of the metrics may take a while.


