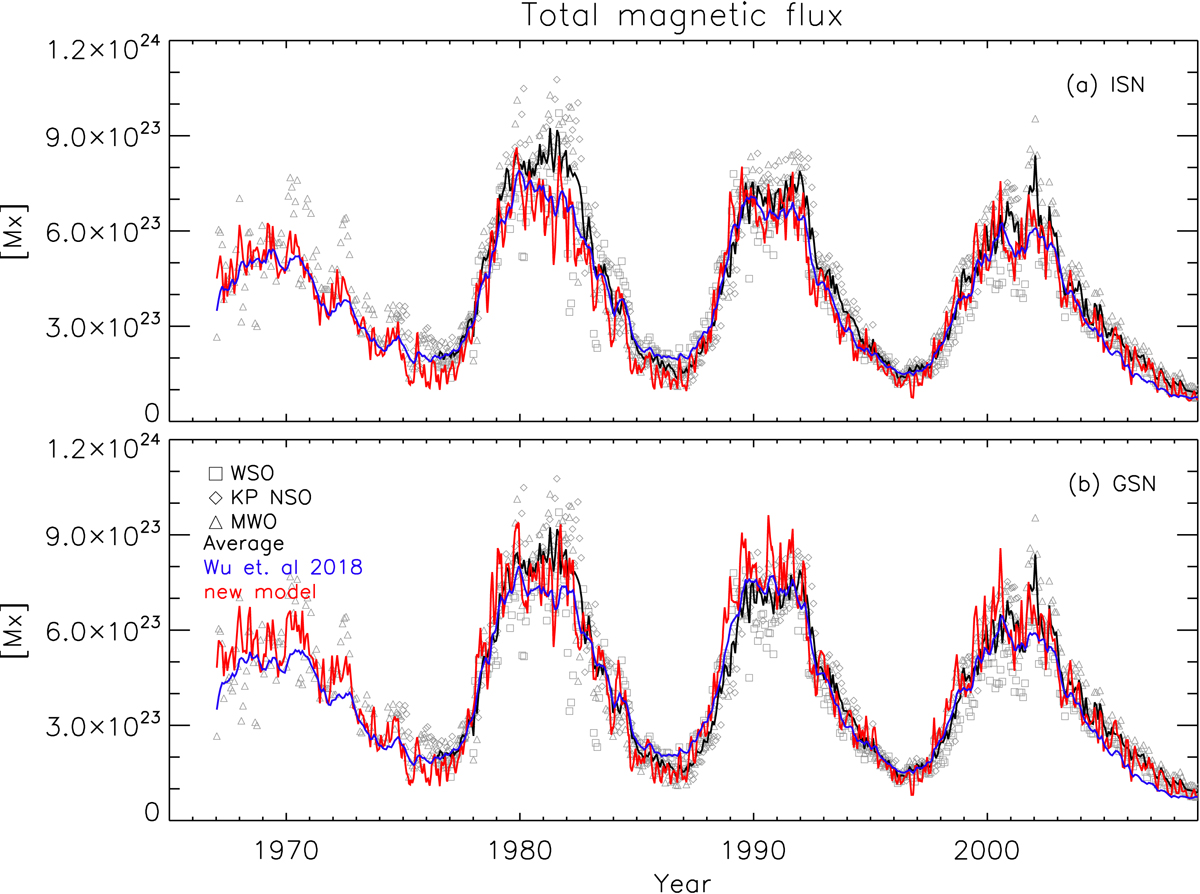
Fig. 3.

Evolution of the total magnetic flux over cycles 21–24 computed with the new (red) and old (blue) models, as well as the observed flux. For observations, symbols show individual Carrington rotations and observatories, as indicated in the legend, and solid black line shows their average. For the models, means of the daily total magnetic flux over the Carrington rotations are shown, and the contribution of the SSEs is reduced by a factor of 0.4 (see text for details). Panels a,b: use ISN and GSN as input, respectively.
Current usage metrics show cumulative count of Article Views (full-text article views including HTML views, PDF and ePub downloads, according to the available data) and Abstracts Views on Vision4Press platform.
Data correspond to usage on the plateform after 2015. The current usage metrics is available 48-96 hours after online publication and is updated daily on week days.
Initial download of the metrics may take a while.


