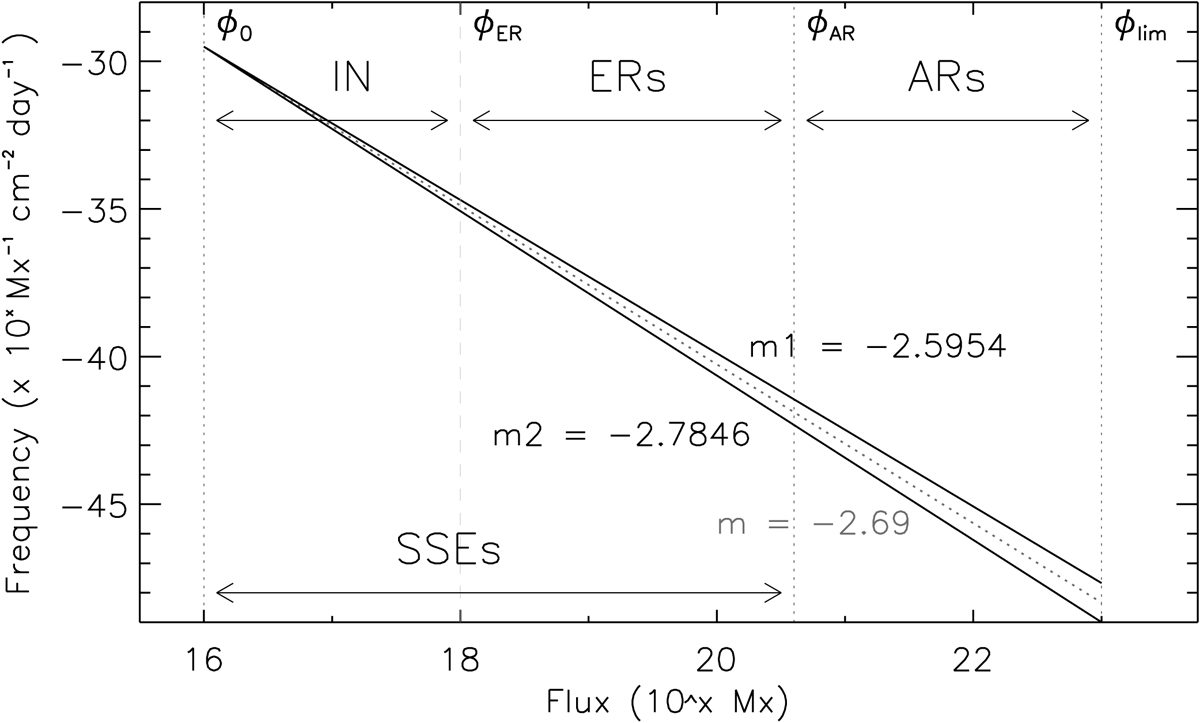
Fig. 1.

Frequency of emergence vs. the unsigned flux of an emergence event (see Eq. (9) following Thornton & Parnell 2011). The values ϕ0, ϕER, ϕAR, and ϕlimit represent the limit below which the local dynamo flux dominates, the minimum ephemeral region flux, the minimum active region flux, and the upper limit of the active region flux, respectively. The horizontal arrows mark the flux ranges corresponding to the internetwork (IN), ERs, ARs, and SSEs. The SSE range includes IN fields and ERs. The slope m of the distribution was derived by Thornton & Parnell (2011) by fitting various observations at different activity levels. Slopes m1 and m2 represent the corresponding distributions at maximum and minimum of solar activity levels for cycle 21, respectively (see main text for details).
Current usage metrics show cumulative count of Article Views (full-text article views including HTML views, PDF and ePub downloads, according to the available data) and Abstracts Views on Vision4Press platform.
Data correspond to usage on the plateform after 2015. The current usage metrics is available 48-96 hours after online publication and is updated daily on week days.
Initial download of the metrics may take a while.


