Fig. 8.
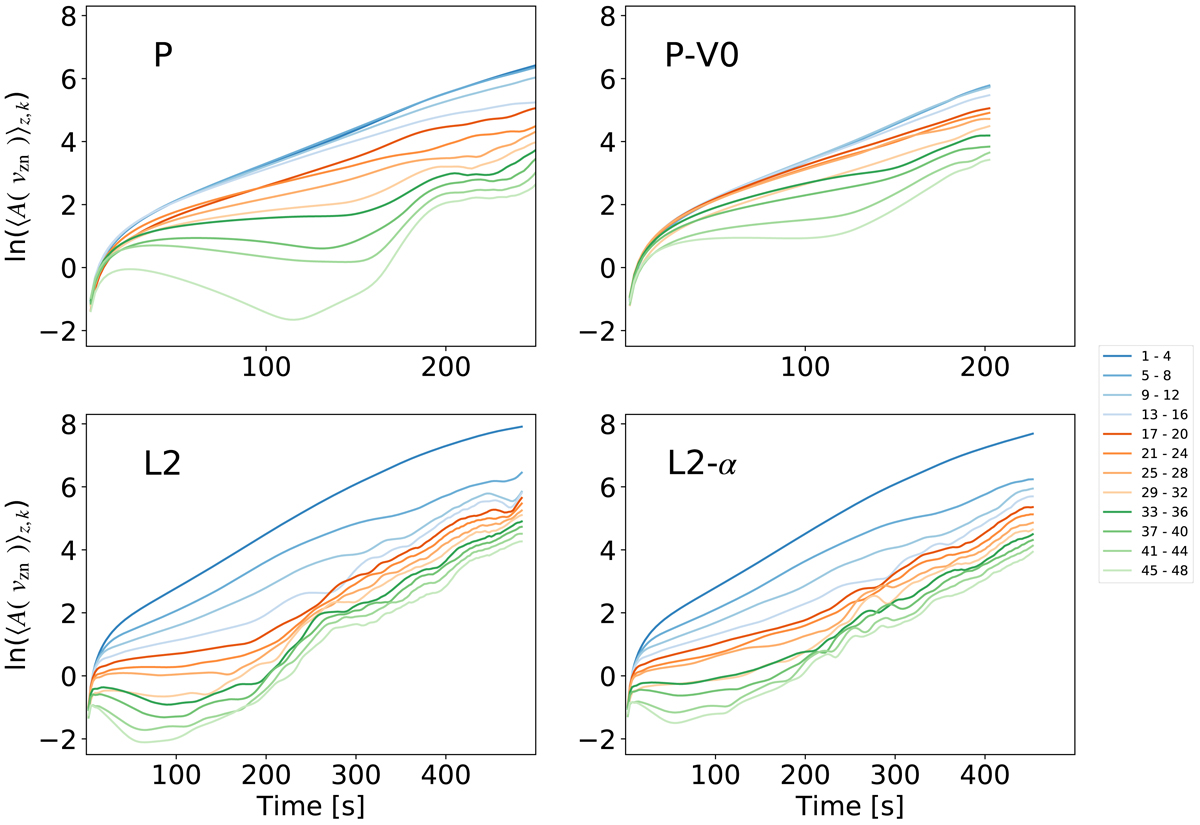
Time evolution of individual horizontal mode Fourier harmonics, computed from the vertical velocity of neutrals, as a function of time. The colored lines show the Fourier amplitudes of the harmonics, grouped in sets of four, from n = 1 to n = 48 (see legend at right). The amplitudes are averaged between heights −L0 and L0 and within each group. The results for four simulations are shown: P (top left); P-V0 (top right); L2 (bottom left); L2-α (bottom right).
Current usage metrics show cumulative count of Article Views (full-text article views including HTML views, PDF and ePub downloads, according to the available data) and Abstracts Views on Vision4Press platform.
Data correspond to usage on the plateform after 2015. The current usage metrics is available 48-96 hours after online publication and is updated daily on week days.
Initial download of the metrics may take a while.