Free Access
Fig. 2.
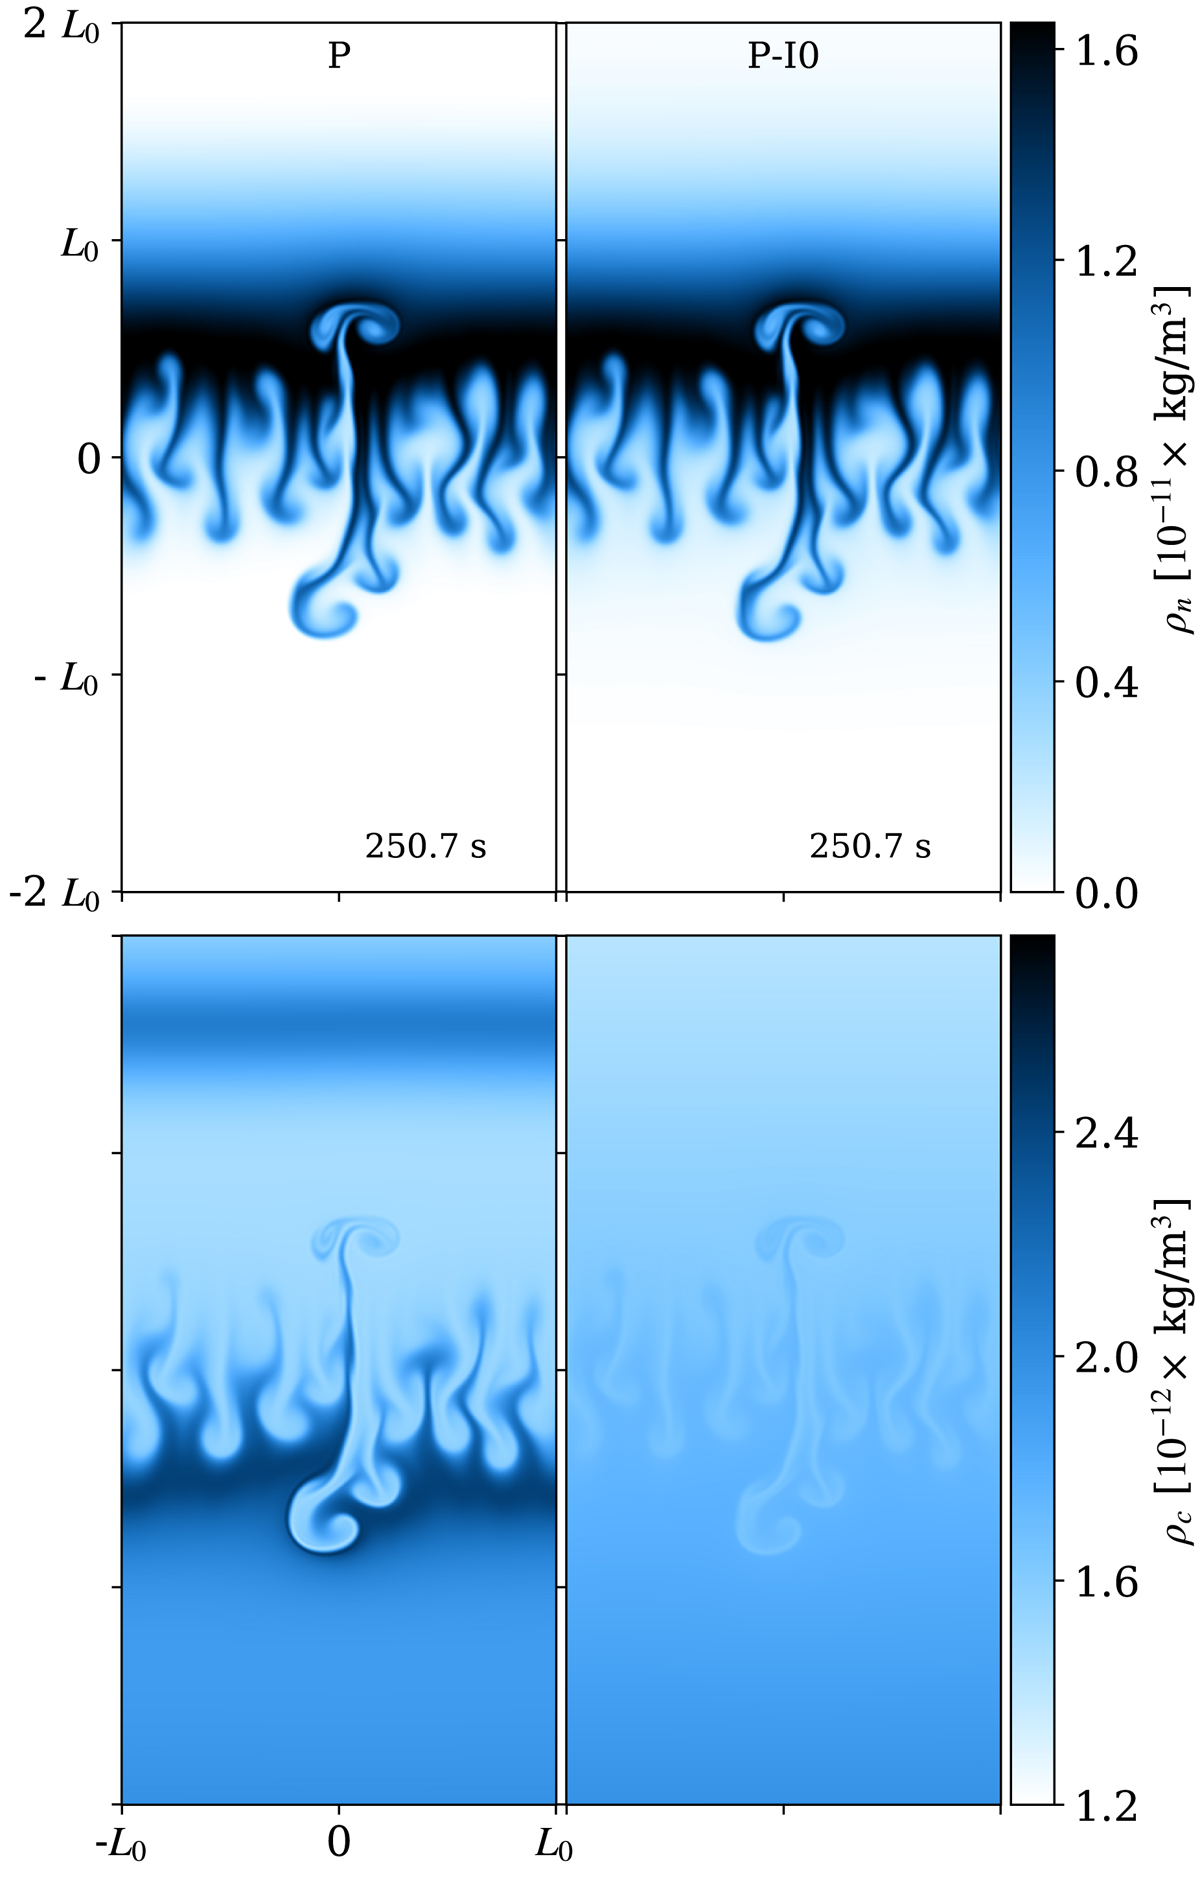
Snapshots of the neutral density (top) and charge density (bottom) for the simulations P (left) and P-I0 (right). The snapshots were taken at the same moment in time. Here and below, only a portion of the domain between −2L0 and 2L0 in the z direction is shown.
Current usage metrics show cumulative count of Article Views (full-text article views including HTML views, PDF and ePub downloads, according to the available data) and Abstracts Views on Vision4Press platform.
Data correspond to usage on the plateform after 2015. The current usage metrics is available 48-96 hours after online publication and is updated daily on week days.
Initial download of the metrics may take a while.