Fig. 14.
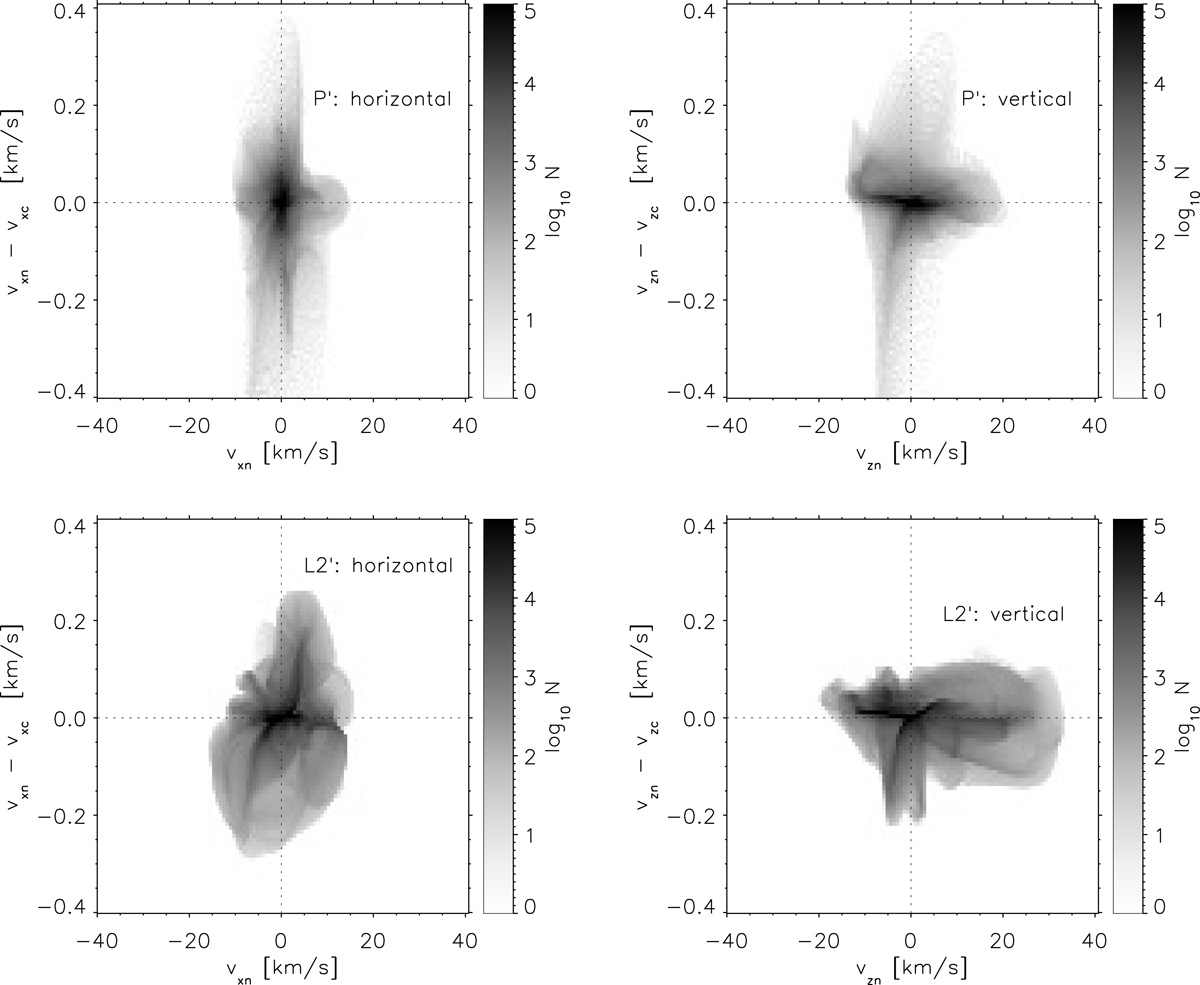
Bivariate probability density functions between the velocity (x-axis) and the decoupling in the velocity (y-axis) for the P′ case (top panels) and L2′ case (bottom panels), where the evolution of the background has been removed. In both cases, all velocity values over the last 50 s of each simulation, and at the vertical location between −2L0 and 2L0 have been considered. Left panels: bivariate probability density functions corresponding to horizontal velocity. Right panels: same, but for the vertical velocity. The vertical dotted line gives the location of zero velocity value.
Current usage metrics show cumulative count of Article Views (full-text article views including HTML views, PDF and ePub downloads, according to the available data) and Abstracts Views on Vision4Press platform.
Data correspond to usage on the plateform after 2015. The current usage metrics is available 48-96 hours after online publication and is updated daily on week days.
Initial download of the metrics may take a while.