Fig. 13.
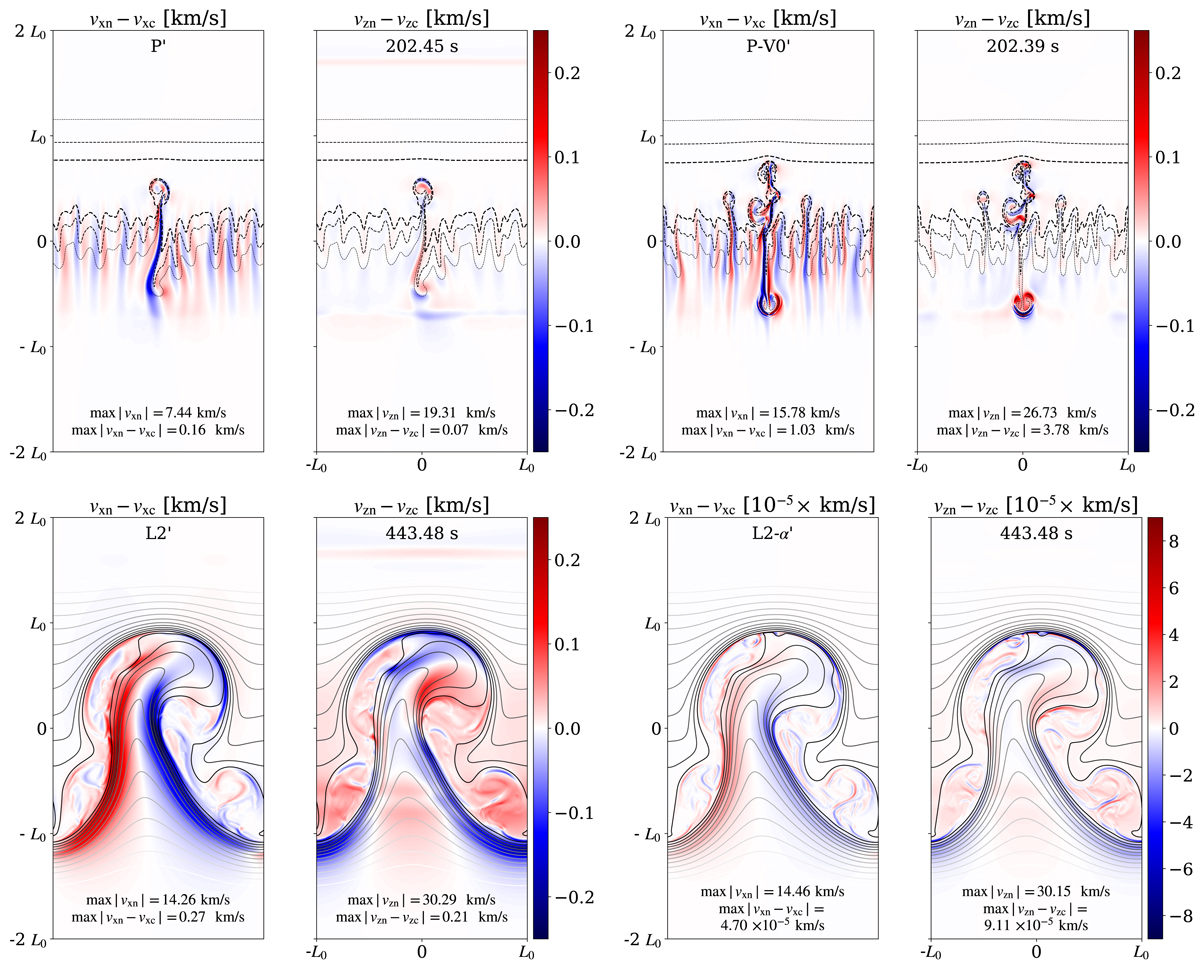
Snapshots of the decoupling in horizontal and vertical velocities. Top left: P′; top right: P-V0′; bottom left: L2′; bottom right: L2-α′, where the evolution of the background has been removed. The snapshots in the top row are shown at time ≈202 s, and those in the bottom row at time ≈443 s. The isocontours of the neutral density spanning the range from the minimum to the maximum value are plotted for the snapshots of P′ and P-V0′ simulations (top). The magnetic field lines are plotted over the L2′ and L2-α′ snapshots as isocontours of the magnetic potential (bottom), with levels corresponding to values from 0.6![]() and
and ![]() , where
, where ![]() is the maximum value of |Ay|.
is the maximum value of |Ay|.
Current usage metrics show cumulative count of Article Views (full-text article views including HTML views, PDF and ePub downloads, according to the available data) and Abstracts Views on Vision4Press platform.
Data correspond to usage on the plateform after 2015. The current usage metrics is available 48-96 hours after online publication and is updated daily on week days.
Initial download of the metrics may take a while.