Fig. 6
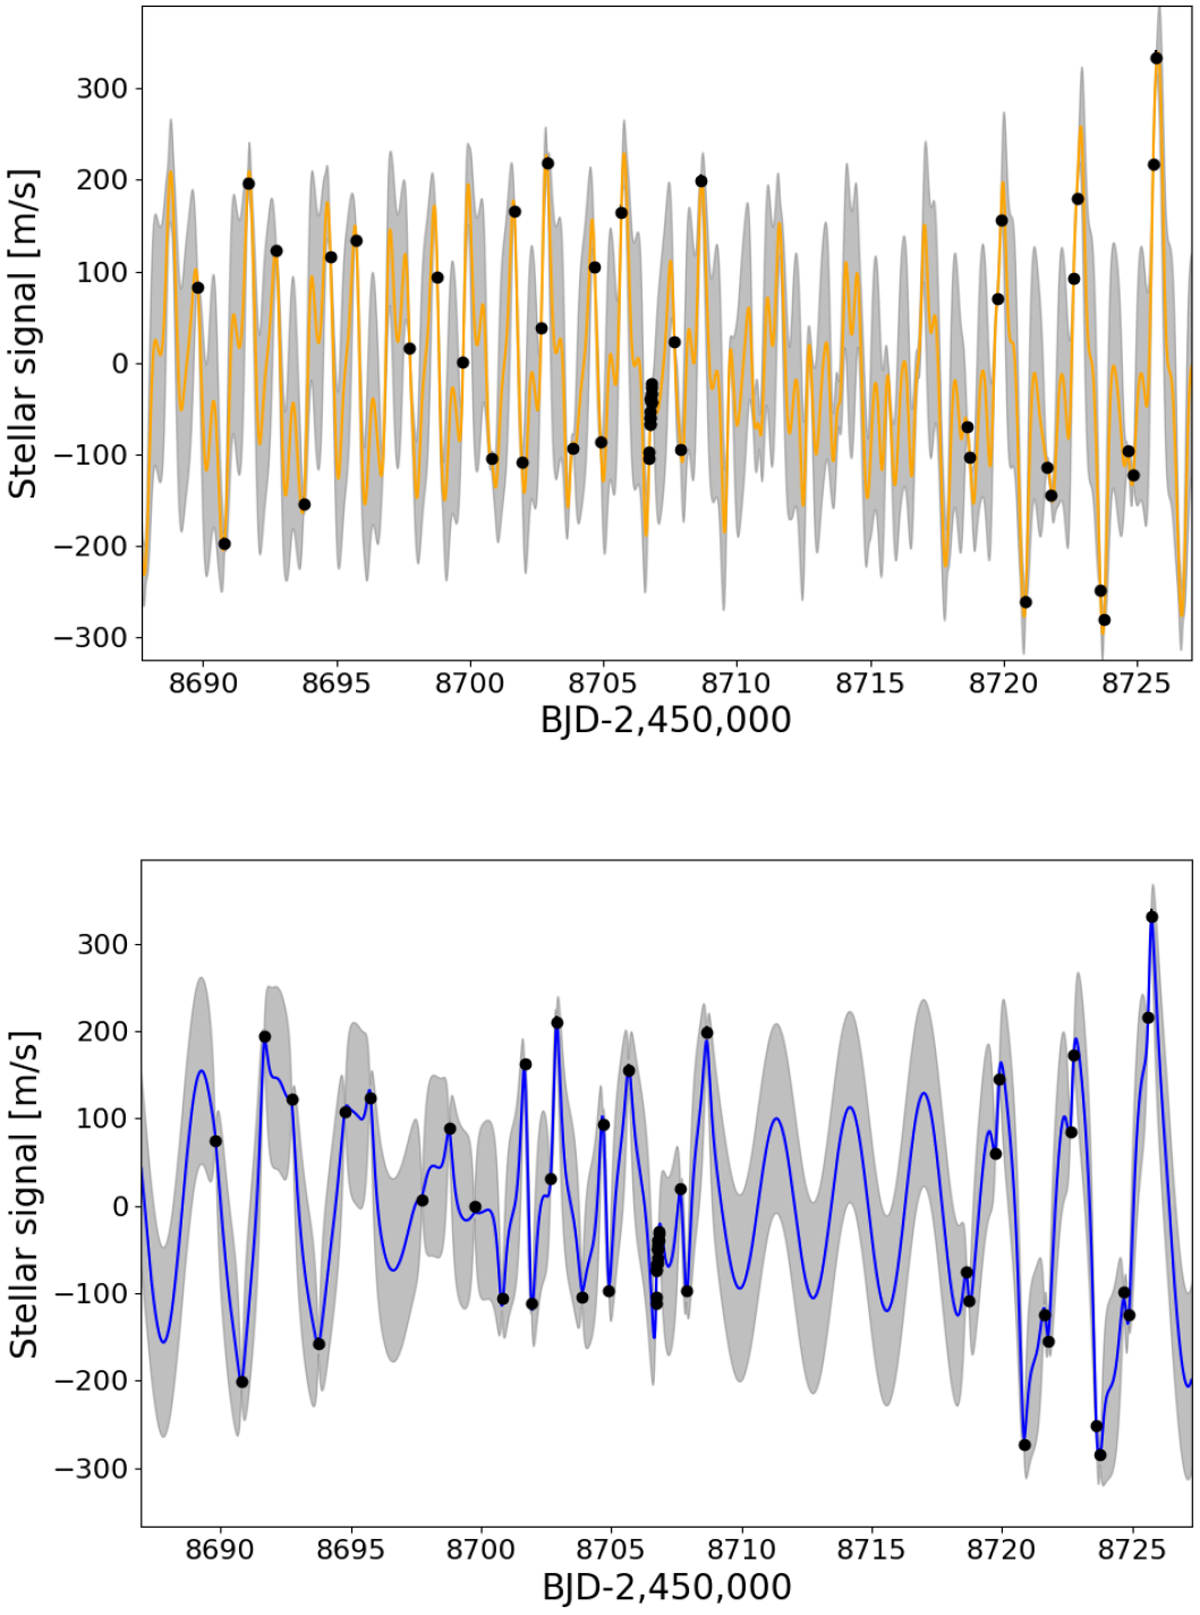
Summary of the GP best-fit model as obtained from the joint analysis of the HARPS+ESPRESSO RVs. Here, we show a portion of the HARPS time series, after removing the best-fit signal induced by planet b. The shaded area in gray represents the ±1σ confidence interval. Upper panel: best-fit model for the GP quasi-periodic kernel (orange line). Lower panel: same as above, but for the GP rotation kernel (blue line).
Current usage metrics show cumulative count of Article Views (full-text article views including HTML views, PDF and ePub downloads, according to the available data) and Abstracts Views on Vision4Press platform.
Data correspond to usage on the plateform after 2015. The current usage metrics is available 48-96 hours after online publication and is updated daily on week days.
Initial download of the metrics may take a while.