Fig. 17
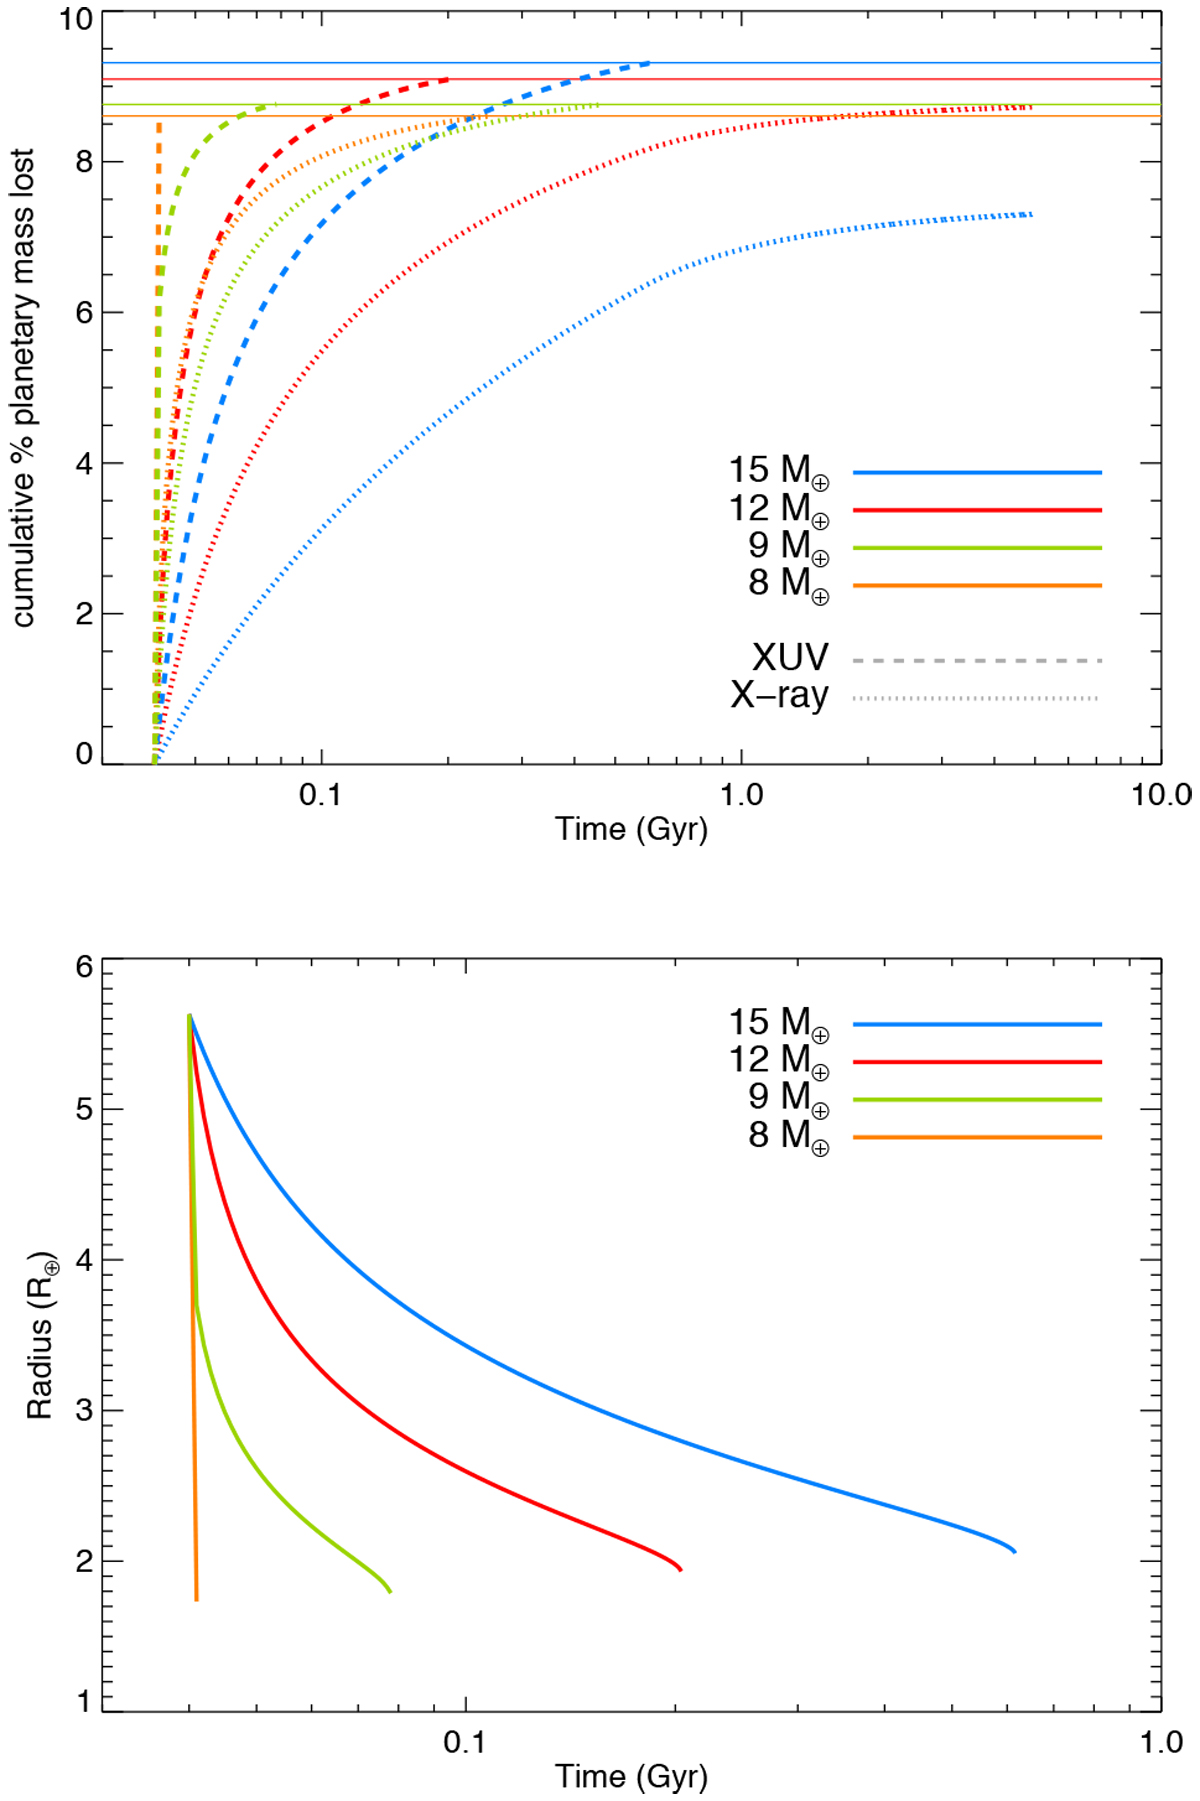
Summary of our simulations on the atmospheric evolution of DS Tuc A b. Upper panel: cumulative percentage of the planetary mass loss evolution considering the X+EUV irradiation (dashed) or X-ray irradiation alone (dotted). We used the results obtained with the evolution by Penz et al. (2008). Horizontal solid lines represent the limits of the atmospheric mass concerning four representative cases with different starting masses, colour-coded as in the legend. Lower panel: radius evolution corresponding to the representative cases according to our models from the present age of the system to the end of the photo-evaporation phase.
Current usage metrics show cumulative count of Article Views (full-text article views including HTML views, PDF and ePub downloads, according to the available data) and Abstracts Views on Vision4Press platform.
Data correspond to usage on the plateform after 2015. The current usage metrics is available 48-96 hours after online publication and is updated daily on week days.
Initial download of the metrics may take a while.