Fig. 14
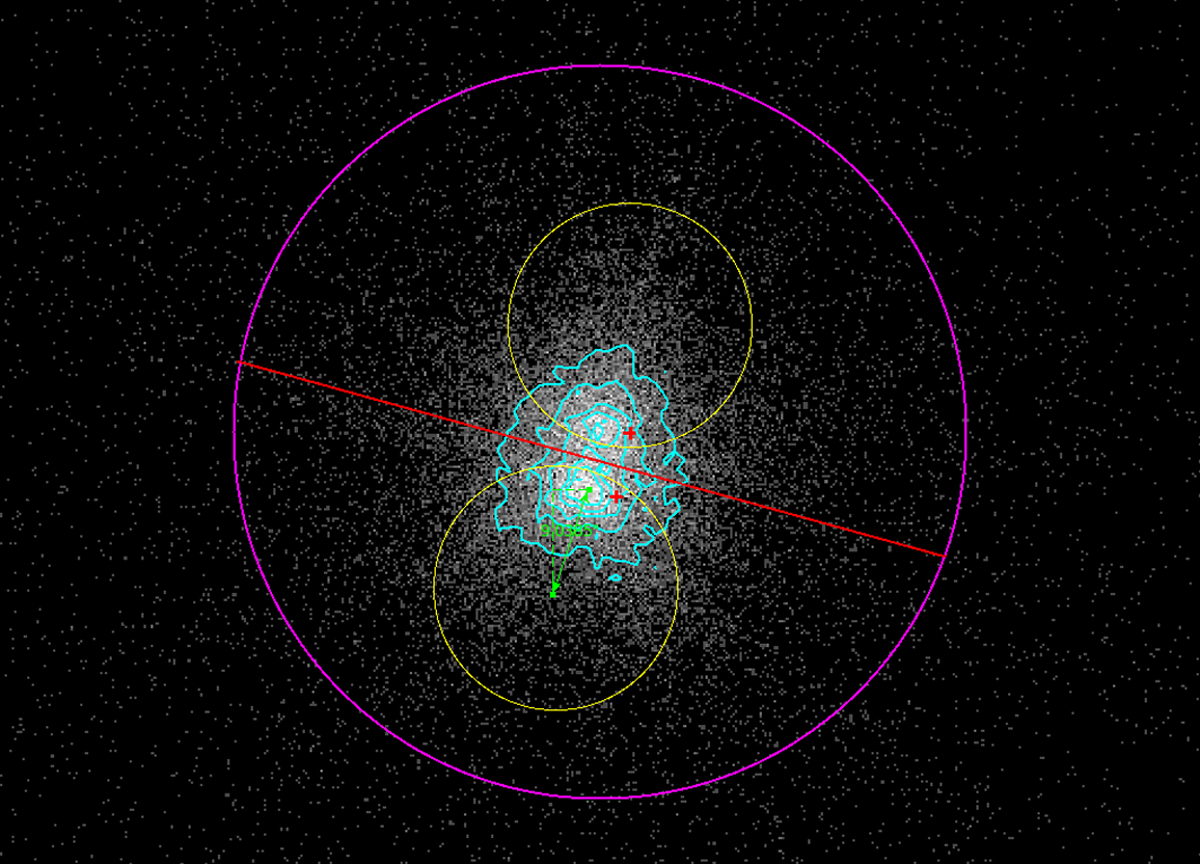
XMM/Newton MOS1 image of DS Tuc. The two red points indicate the ICRS positions of the two stars from SIMBAD, the centroid of X-ray emission is offset because of the proper motions of the system. The contours show the emission of the two sources, marginally resolved. The large circle (in red) has 30′′ radius, while the smaller circles (in yellow) are 10′′ wide. They were used to extract the spectra and light curves of the A and B system components (see text).
Current usage metrics show cumulative count of Article Views (full-text article views including HTML views, PDF and ePub downloads, according to the available data) and Abstracts Views on Vision4Press platform.
Data correspond to usage on the plateform after 2015. The current usage metrics is available 48-96 hours after online publication and is updated daily on week days.
Initial download of the metrics may take a while.