Fig. 5.
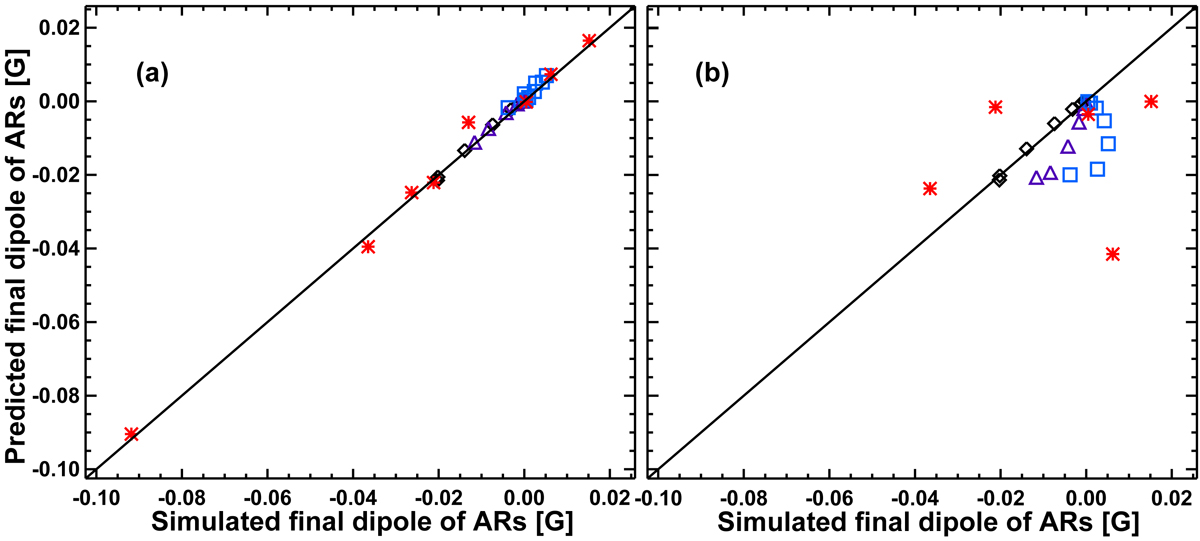
Same as Fig. 1, but for artificially created ARs. The black diamonds represent the results of the symmetric bipolar ARs. The purple triangles represent the results of the weakly asymmetric bipolar ARs. The blue squares represent the results of the strongly asymmetric bipolar ARs. The red asterisks represent the results of the complex ARs. Panel a: results of the generalized method that we introduce; panel b: results of the BMR-based method. We note that for panel b, three points of the complex ARs lie beyond the displayed range, with the most extreme point (−0.092, −0.22).
Current usage metrics show cumulative count of Article Views (full-text article views including HTML views, PDF and ePub downloads, according to the available data) and Abstracts Views on Vision4Press platform.
Data correspond to usage on the plateform after 2015. The current usage metrics is available 48-96 hours after online publication and is updated daily on week days.
Initial download of the metrics may take a while.