Fig. 1.
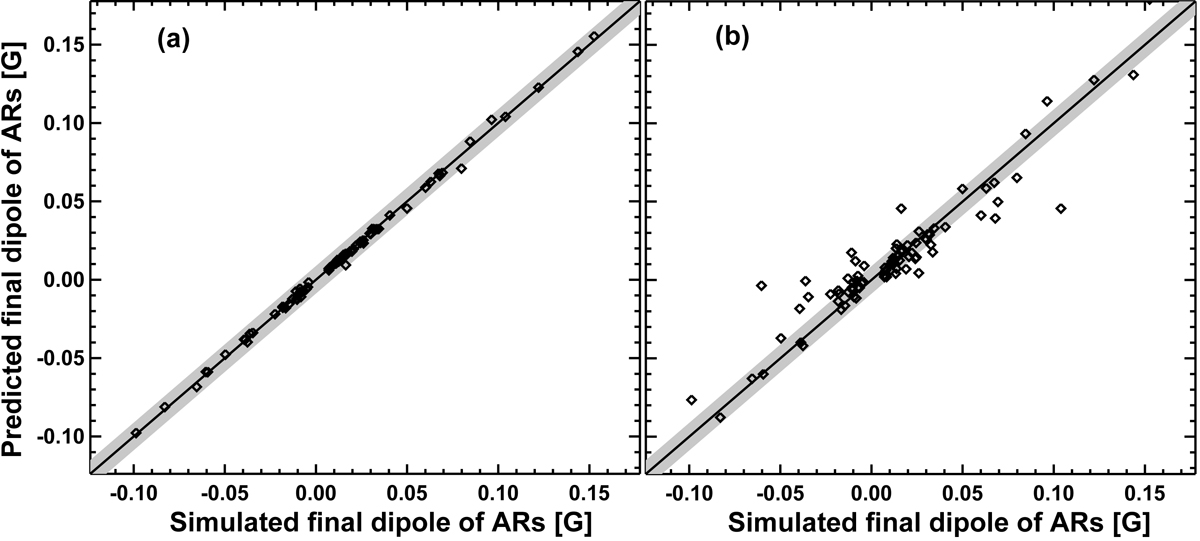
Comparison of the simulated final dipoles of the ARs and those predicted using the algebraic methods. Each diamond represents an AR during CRs 2145-2159. The horizontal x axis represents the final dipole produced by SFT simulations. The vertical y axis represents the final dipole predicted by algebraic methods. Panel a: results of the generalized method that we introduce; panel b: results of the BMR-based method. The diagonal line represents y = x. The gray shaded area represents the region where the final dipole produced by the algebraic methods shows no greater than 0.009G deviation from the result produced by SFT simulations.
Current usage metrics show cumulative count of Article Views (full-text article views including HTML views, PDF and ePub downloads, according to the available data) and Abstracts Views on Vision4Press platform.
Data correspond to usage on the plateform after 2015. The current usage metrics is available 48-96 hours after online publication and is updated daily on week days.
Initial download of the metrics may take a while.