Fig. A.1
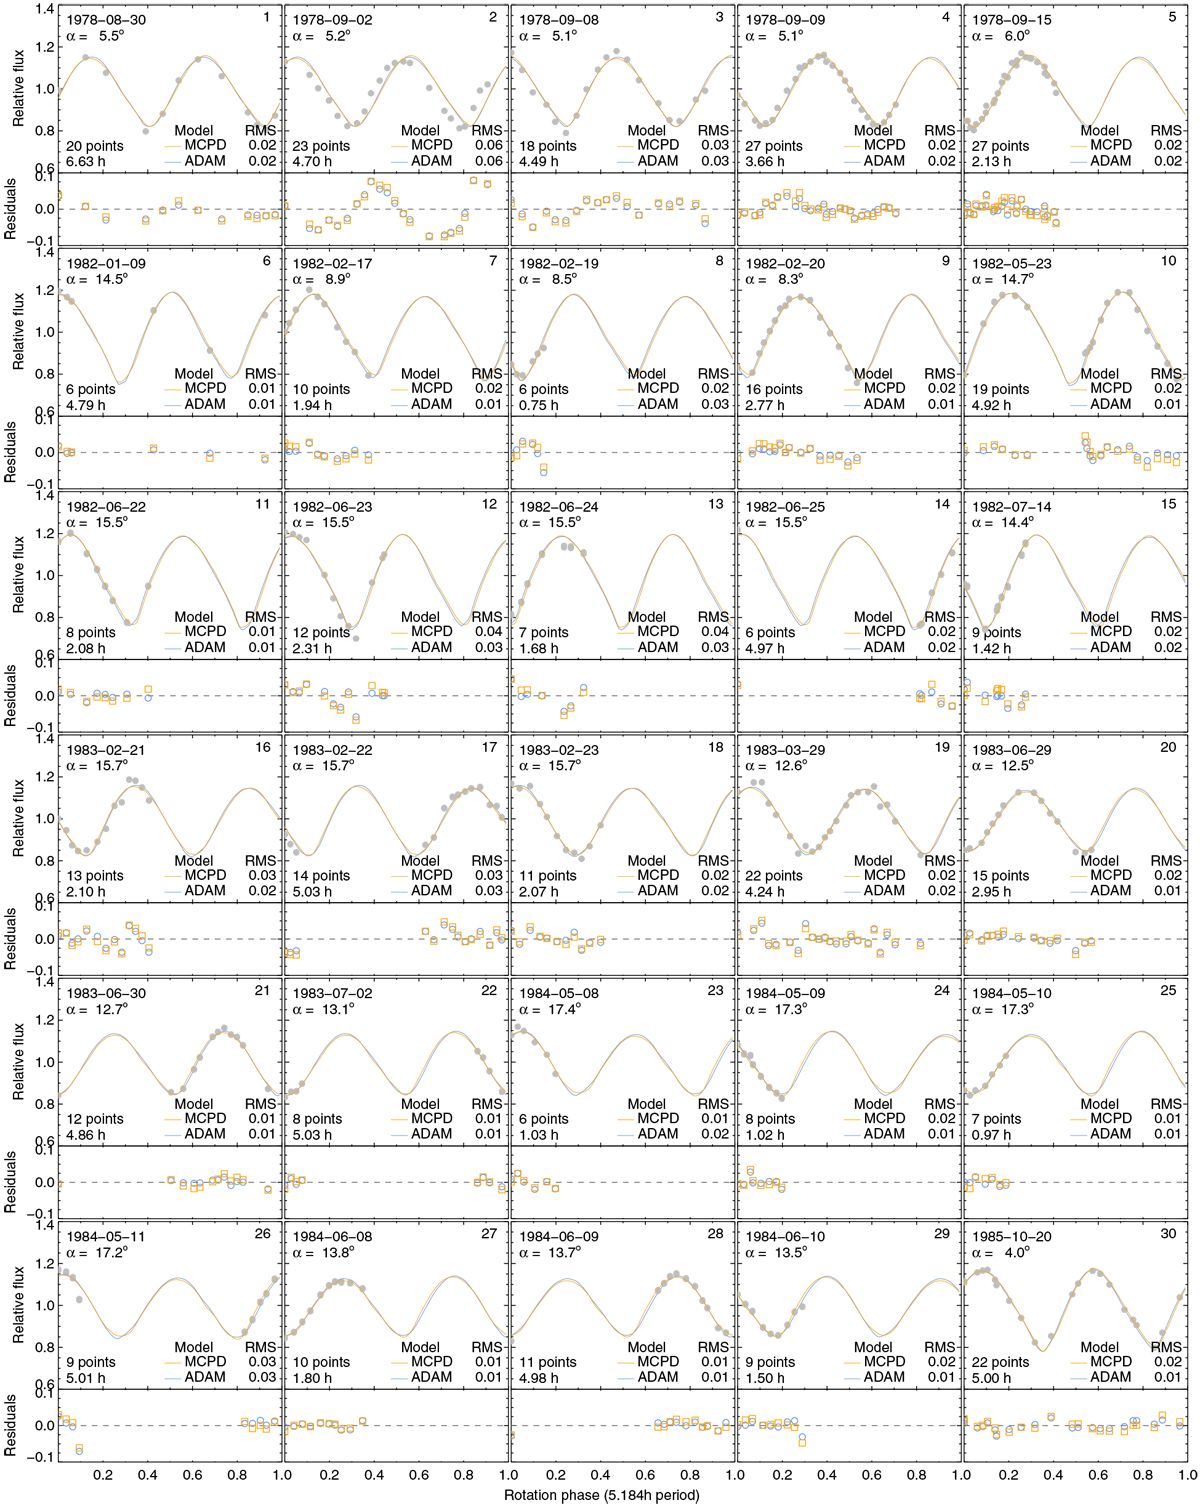
Optical lightcurves of Sylvia (gray dots), compared with the synthetic lightcurves generated with the ADAM and MPCD shape models (blue and orange lines). In each panel, the observing date, number of points, duration of the lightcurve (in hours), and RMS residuals between the observations and the synthetic lightcurves from the shape model are displayed. In many cases, measurement uncertainties are not provided by the observers but can be estimated from the scatter of measurements.
Current usage metrics show cumulative count of Article Views (full-text article views including HTML views, PDF and ePub downloads, according to the available data) and Abstracts Views on Vision4Press platform.
Data correspond to usage on the plateform after 2015. The current usage metrics is available 48-96 hours after online publication and is updated daily on week days.
Initial download of the metrics may take a while.