Fig. 6
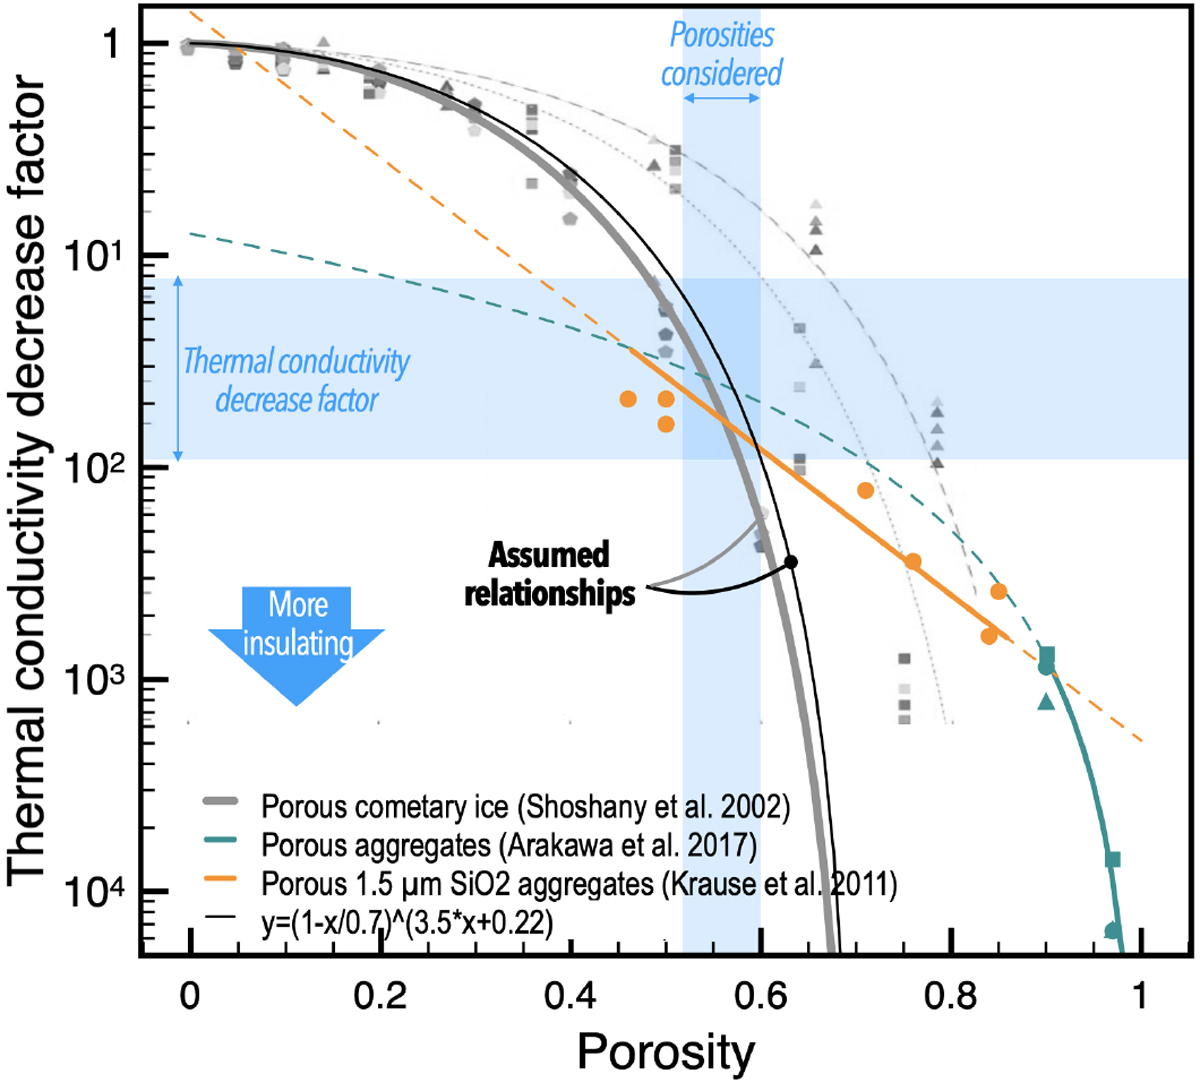
Effect of porosity Φ on the thermal conductivity k. The orange and teal curves show relationships that were only validated in the regimes where the curves are solid. The orange curve is a thermal conductivity in W m−1 K−1 (rather thana decrease factor). Data points of a given color are from the same source as the fit curve of that color.
Current usage metrics show cumulative count of Article Views (full-text article views including HTML views, PDF and ePub downloads, according to the available data) and Abstracts Views on Vision4Press platform.
Data correspond to usage on the plateform after 2015. The current usage metrics is available 48-96 hours after online publication and is updated daily on week days.
Initial download of the metrics may take a while.