Open Access
Fig. 9
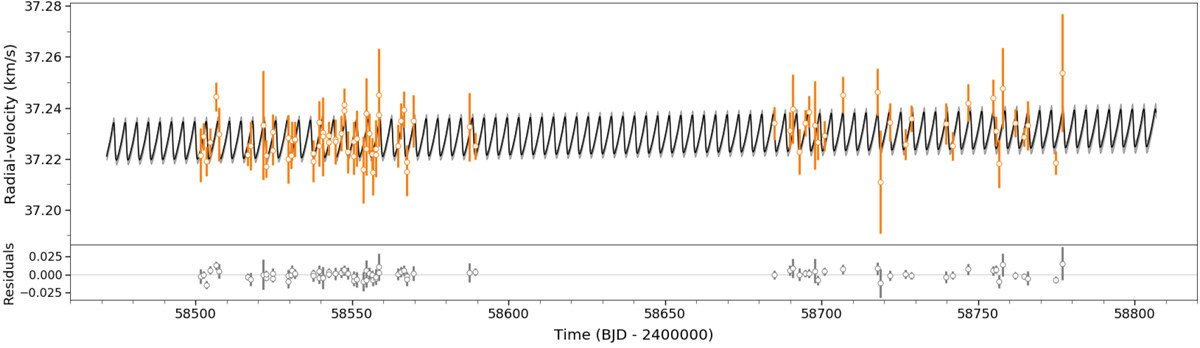
HARPS radial-velocity measurements for TOI-269. The data points with errors are shown in orange; the black line and gray band correspond respectively to the median and 1σ of 1000 randomly chosen posterior samples from the joint fit.
Current usage metrics show cumulative count of Article Views (full-text article views including HTML views, PDF and ePub downloads, according to the available data) and Abstracts Views on Vision4Press platform.
Data correspond to usage on the plateform after 2015. The current usage metrics is available 48-96 hours after online publication and is updated daily on week days.
Initial download of the metrics may take a while.