Fig. 7
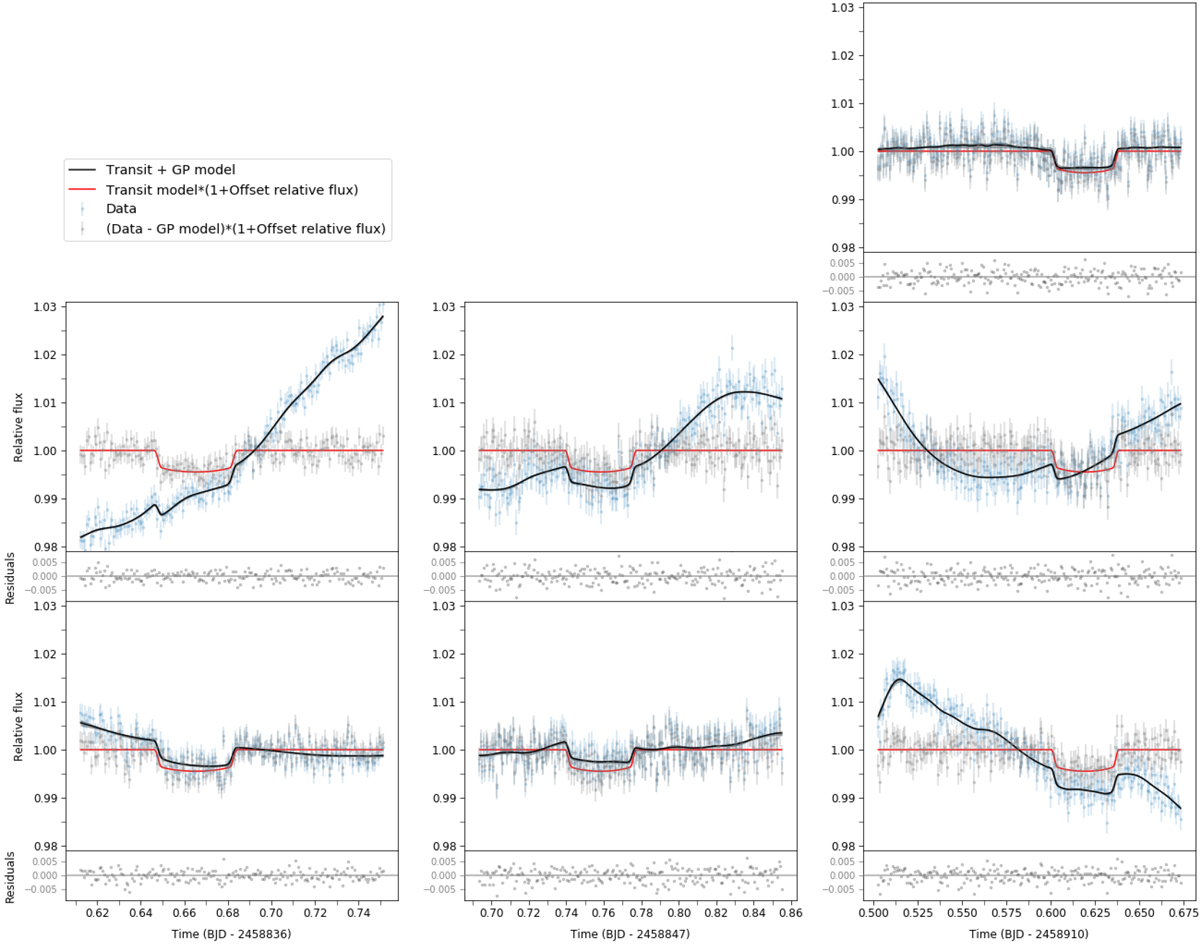
ExTrA light curves for the three nights of observations (columns) and for each telescope (first line corresponding to telescope 1, second line to telescope 2, and third line to telescope 3). Our raw data are shown in blue, and modeled using Gaussian processes in black. The detrended light curves are shown (gray dots), with the maximum a posteriori model transit (in red). The residuals below correspond to the modeled transit subtracted from detrended data points.
Current usage metrics show cumulative count of Article Views (full-text article views including HTML views, PDF and ePub downloads, according to the available data) and Abstracts Views on Vision4Press platform.
Data correspond to usage on the plateform after 2015. The current usage metrics is available 48-96 hours after online publication and is updated daily on week days.
Initial download of the metrics may take a while.