Fig. 6
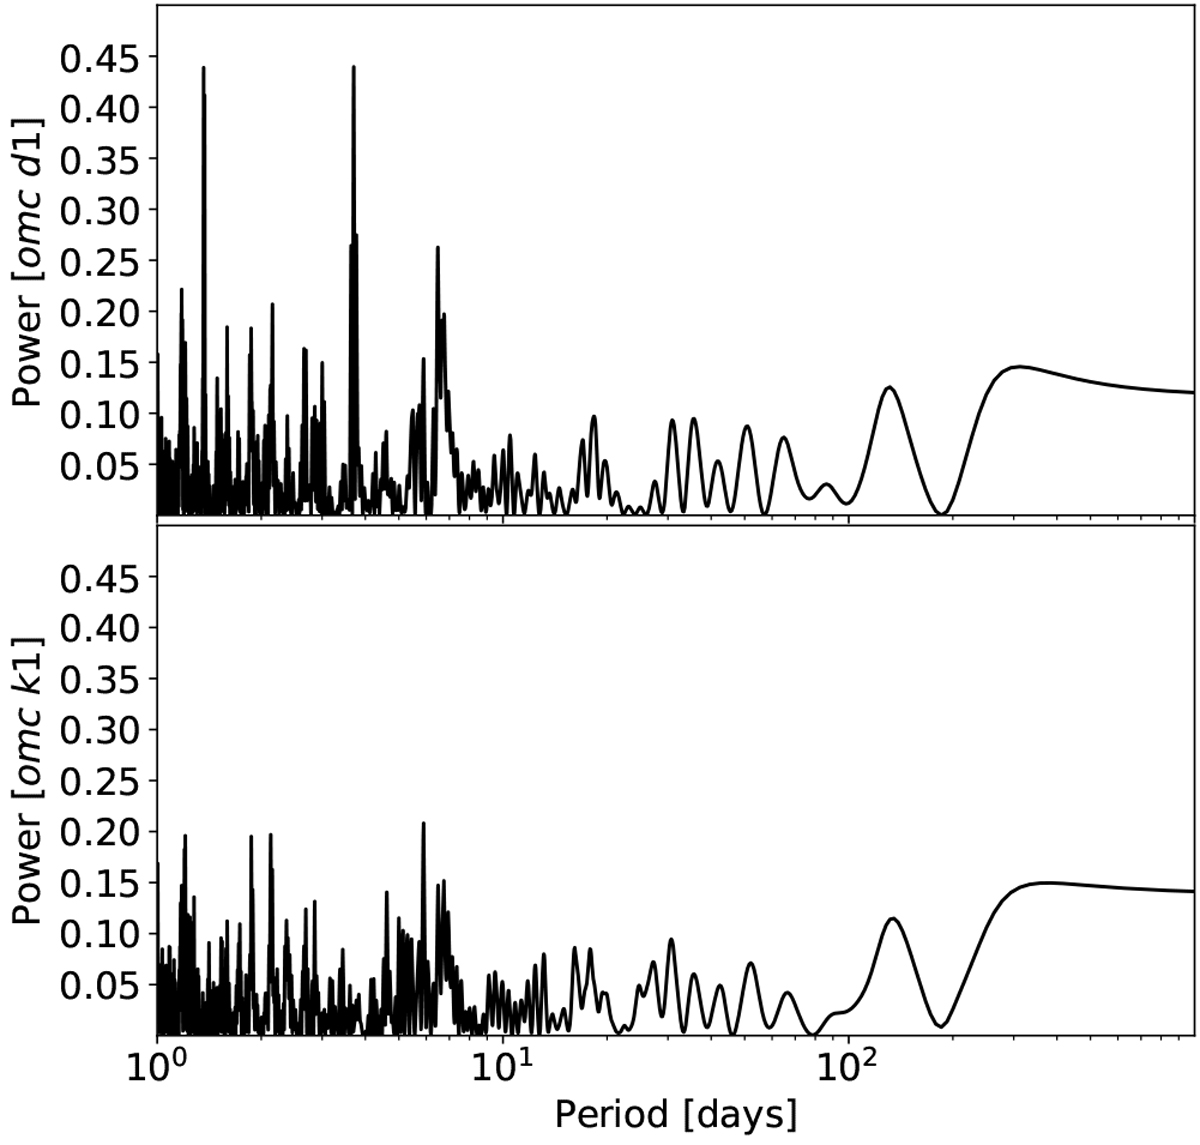
Analysis of the HARPS radial velocities. Periodogram for RV time series where a linear drift was subtracted is shown in the top panel. We can see a peak at 3.7 days corresponding to the period of the planet, and another at 1.36 days corresponding to its alias. Both peaks have a false alarm probability ≪ 1%. The lower panel is the periodogram for RVs where a linear drift and Keplerian (for the first planet) were subtracted; the highest peak at 5.9 days has a false alarm probability of 20.8%.
Current usage metrics show cumulative count of Article Views (full-text article views including HTML views, PDF and ePub downloads, according to the available data) and Abstracts Views on Vision4Press platform.
Data correspond to usage on the plateform after 2015. The current usage metrics is available 48-96 hours after online publication and is updated daily on week days.
Initial download of the metrics may take a while.