Fig. 17

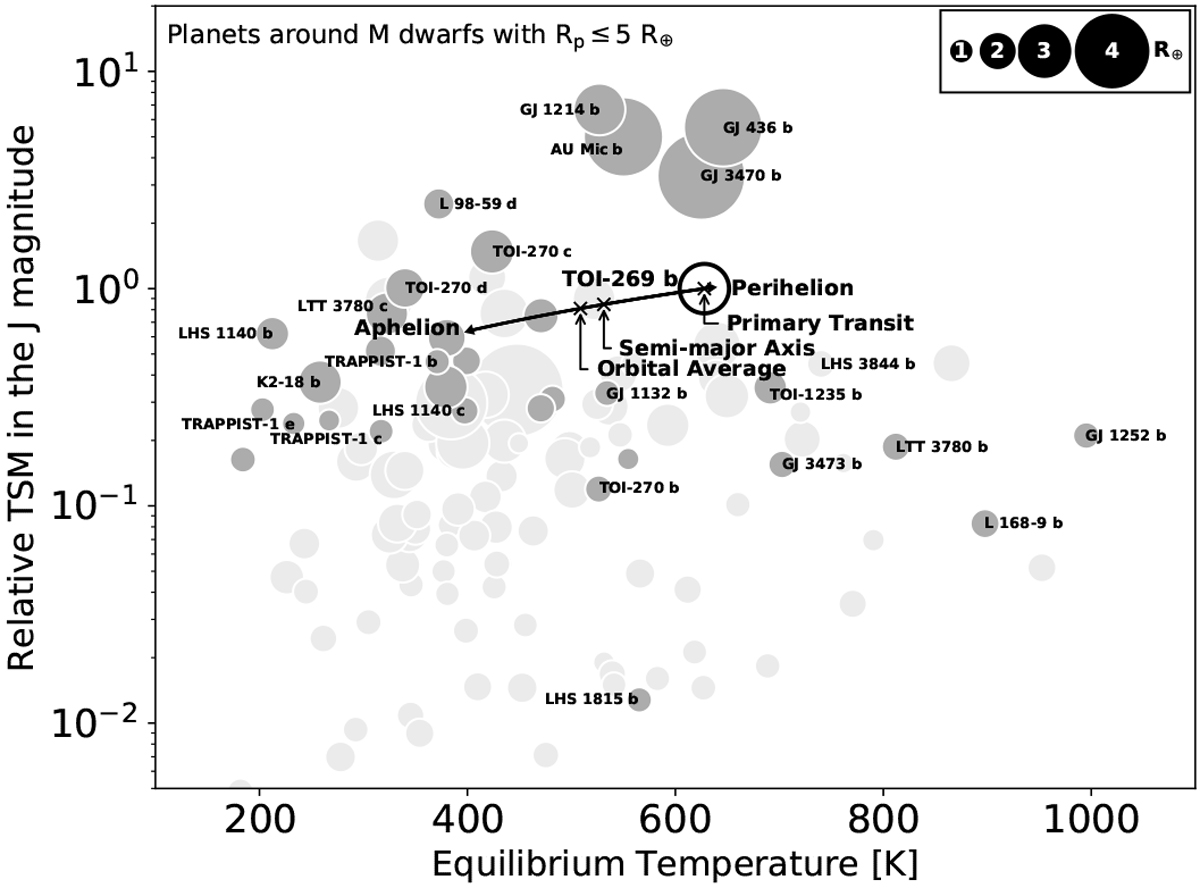
Transmission spectroscopic metric in the J magnitude as a function of the planetary equilibrium temperature. The TSM values are shown relatively to the TOI-269 b (eccentricity-corrected) reference value of ![]() . Only planets orbiting M dwarf (Teff ≤ 3875 [K]) and with Rp ≤ 5 R⊕ were selected. TOI-269 b is shown as a black circle. The black arrow shows the range of equilibrium temperature depending on planet position during the orbit. The crosses show the locations of the orbital average, the semi-major axis, and the primary transit. Other planets with and without measured masses are shown in dark gray and light gray, respectively.
. Only planets orbiting M dwarf (Teff ≤ 3875 [K]) and with Rp ≤ 5 R⊕ were selected. TOI-269 b is shown as a black circle. The black arrow shows the range of equilibrium temperature depending on planet position during the orbit. The crosses show the locations of the orbital average, the semi-major axis, and the primary transit. Other planets with and without measured masses are shown in dark gray and light gray, respectively.
Current usage metrics show cumulative count of Article Views (full-text article views including HTML views, PDF and ePub downloads, according to the available data) and Abstracts Views on Vision4Press platform.
Data correspond to usage on the plateform after 2015. The current usage metrics is available 48-96 hours after online publication and is updated daily on week days.
Initial download of the metrics may take a while.


