Fig. 4.
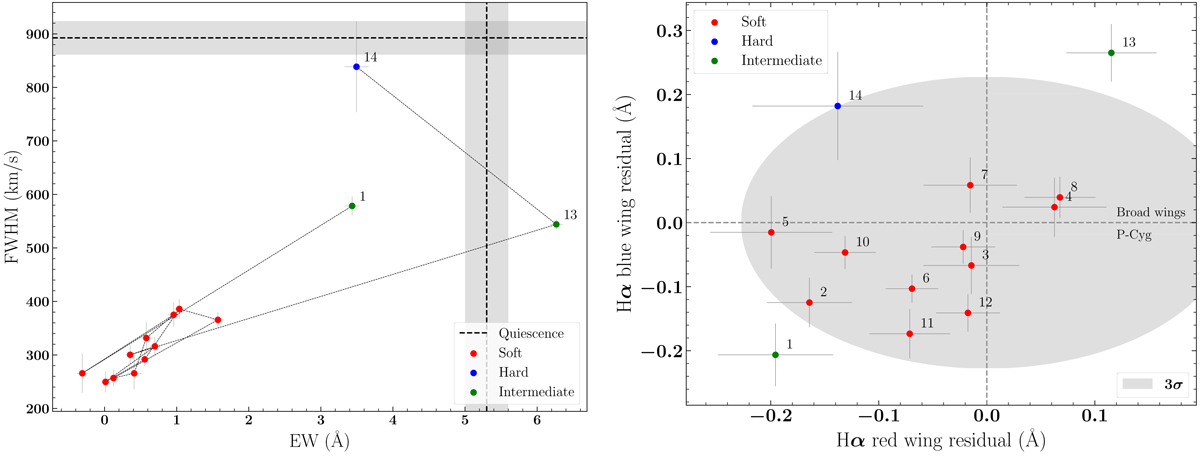
Diagnostic diagrams. Colour code is the same as in Fig. 1. Left panel: Hα FWHM versus its EW measured in a 44 Å-wide (∼2000 km s−1) region centred at the rest frame of the binary. The quiescent values of EW and FWHM (Shahbaz et al. 1997; Garcia et al. 1999) are indicated as vertical and horizontal black dashed lines, respectively (grey bands indicate uncertainties). The FWHM quiescent value reported in Garcia et al. (1999) (830 ± 25 km s−1) has been downgraded to the spectral resolution of our data. Right panel: Hα blue and red wing residuals (excesses) for the 14 epochs. The grey-shaded region indicates the 3σ significance contour.
Current usage metrics show cumulative count of Article Views (full-text article views including HTML views, PDF and ePub downloads, according to the available data) and Abstracts Views on Vision4Press platform.
Data correspond to usage on the plateform after 2015. The current usage metrics is available 48-96 hours after online publication and is updated daily on week days.
Initial download of the metrics may take a while.