Fig. 5.
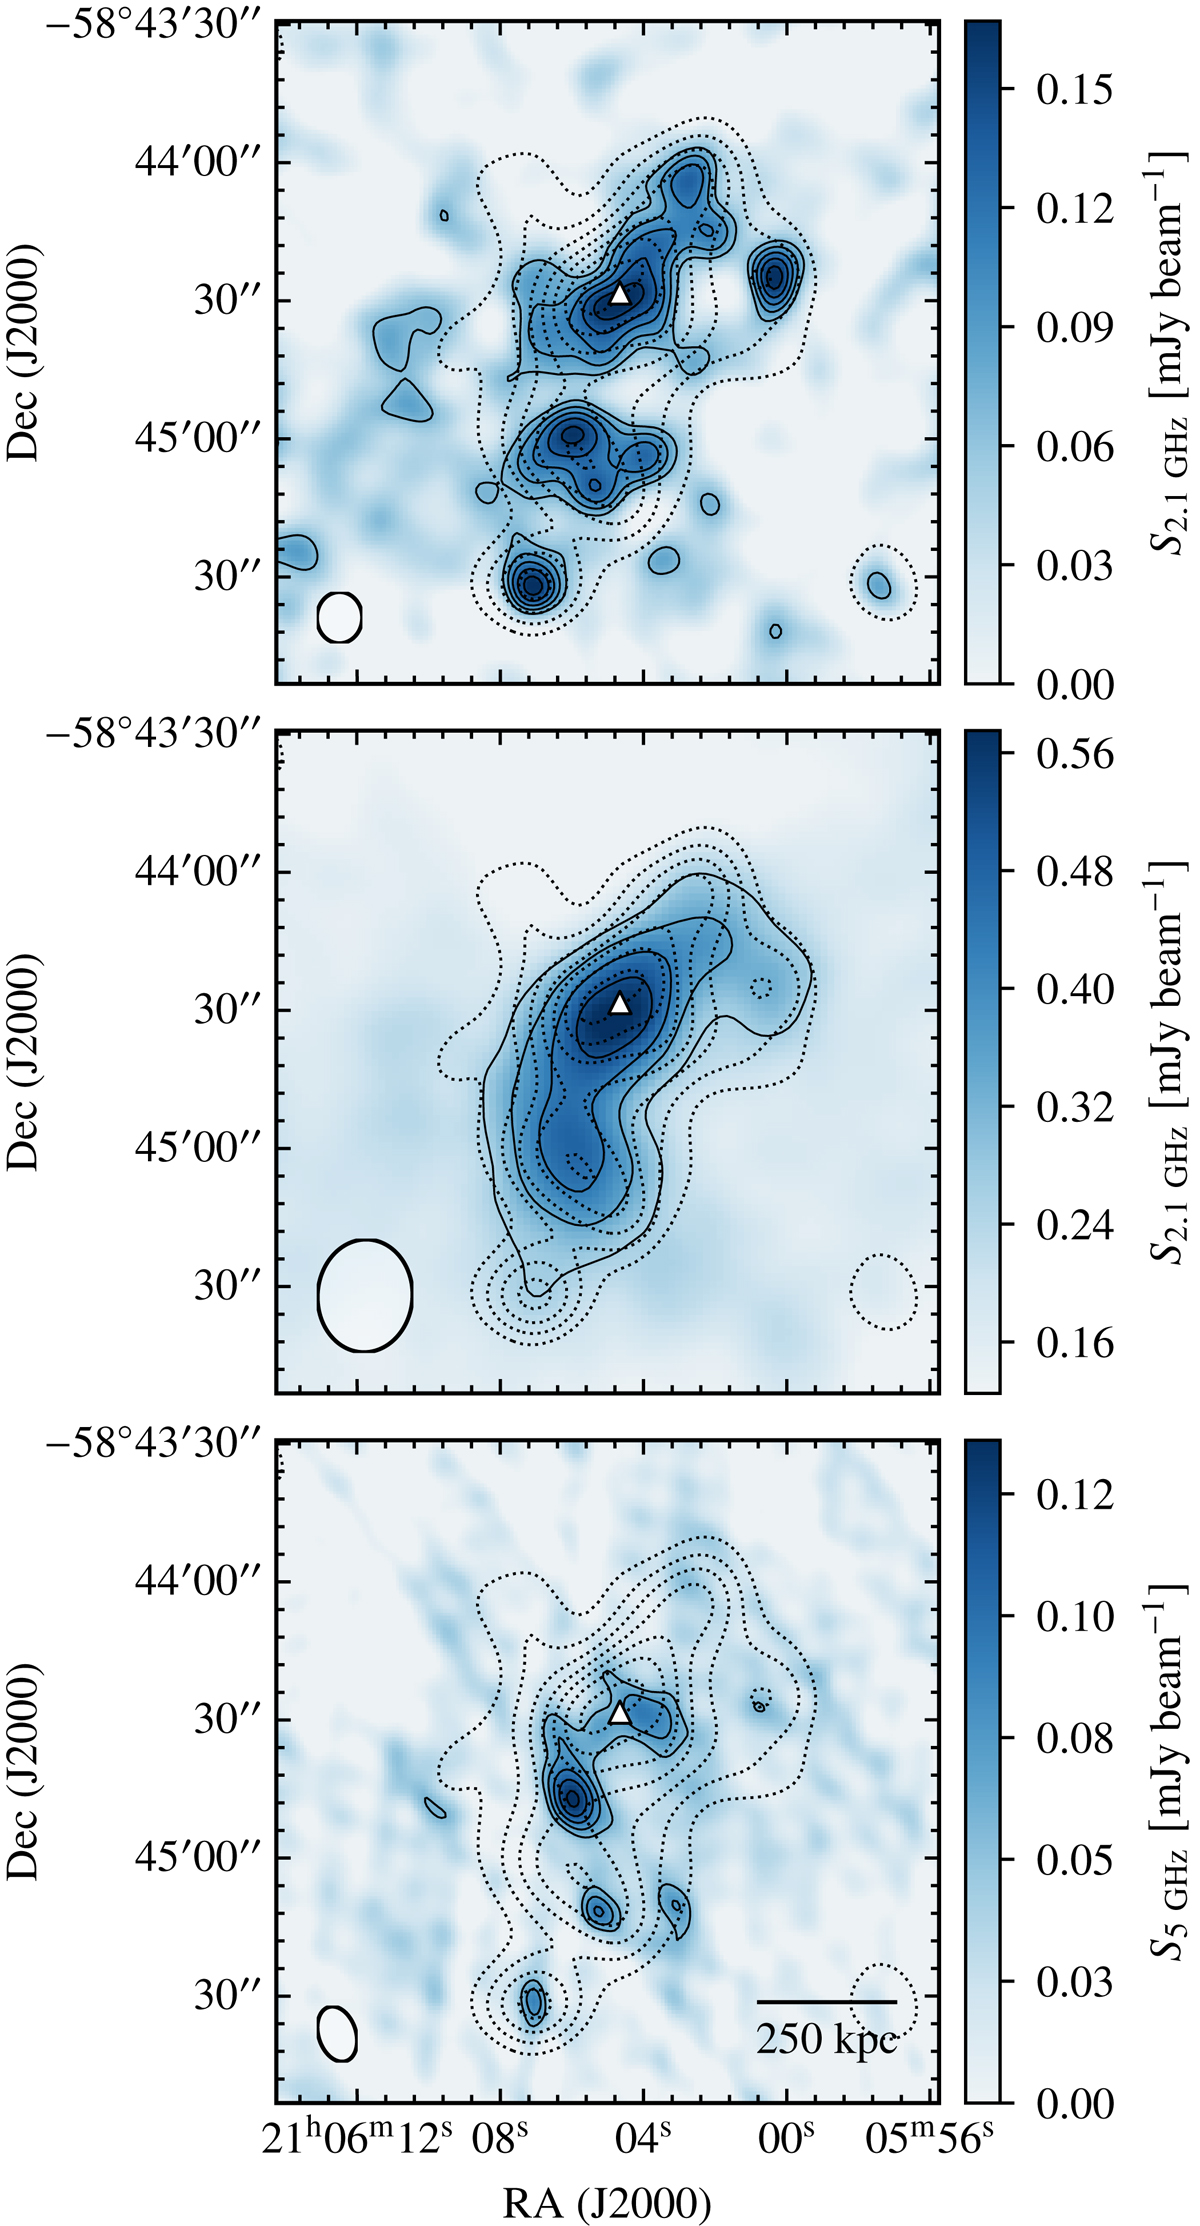
ATCA observations after subtraction of compact source components (see Sect. 2.4 for details). The maps correspond to the 2.1 GHz data generated assuming Briggs weighting with robust parameter set to 0.00 (upper; σ = 23 μJy beam−1), and to the naturally weighted 2.1 GHz (middle; σ = 87 μJy beam−1) and 5 GHz (lower; σ = 19 μJy beam−1) images. As in Fig. 3, the triangle marks the BCG position (Song et al. 2012). To better highlight the extended radio features, we applied uv-tapers of 10 and 20 kλ to the 2.1 and 5 GHz measurements, respectively. For all panels, the contours start from the 3σ level, with increment every 1σ. The higher resolution offered by ATCA allows us to disentangle the small-scale morphology of the diffuse radio structure detected by EMU (dotted contours).
Current usage metrics show cumulative count of Article Views (full-text article views including HTML views, PDF and ePub downloads, according to the available data) and Abstracts Views on Vision4Press platform.
Data correspond to usage on the plateform after 2015. The current usage metrics is available 48-96 hours after online publication and is updated daily on week days.
Initial download of the metrics may take a while.