Fig. 2.
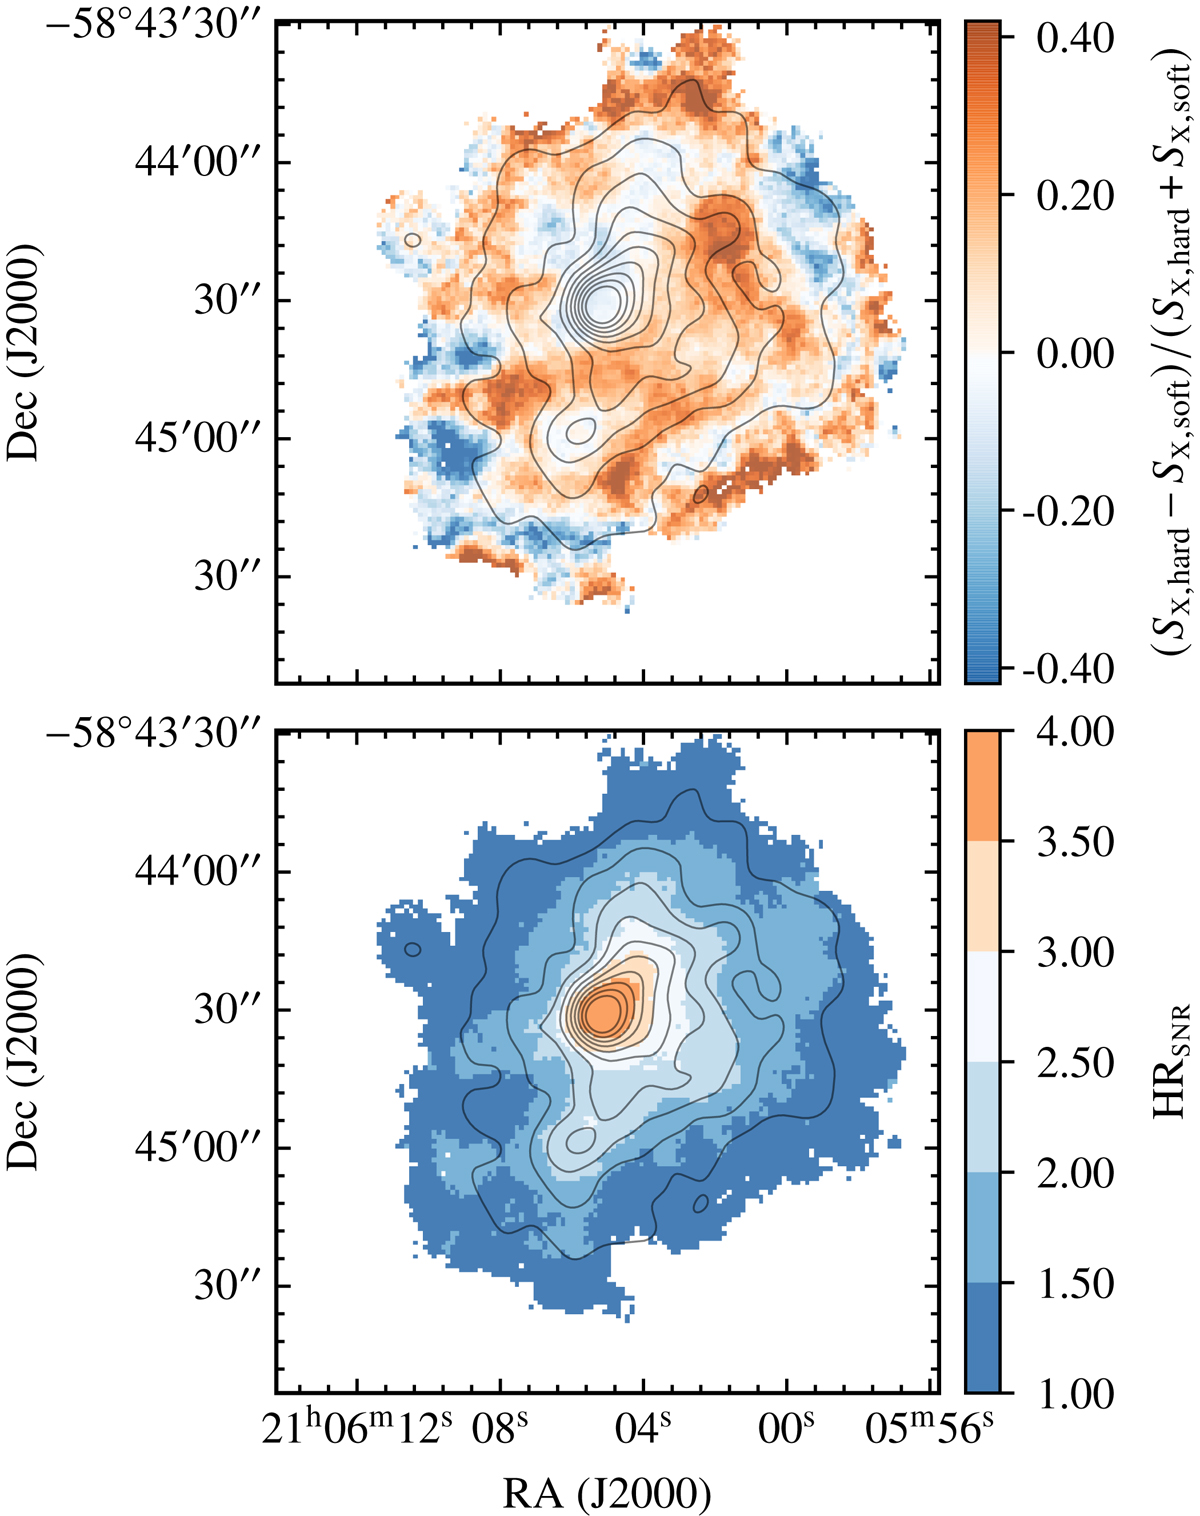
Hardness ratio map (top) and corresponding significance (bottom) based on the surface brightness image at the energy bands 0.3–1.5 keV and 1.5–7.5 keV. Prior to computing the hardness ratio map, the images in each of the energy bands are filtered with a top-hat kernel with radius of 7.5″. Further, in order to suppress regions at low signal-to-noise, we mask all the pixels in the hardness ratio map whose corresponding surface brightness is lower than 2% of the amplitude of the X-ray peak. For reference, we overlay on the hardness ratio map the same contours shown in Fig. 1 from the smoothed X-ray surface brightness.
Current usage metrics show cumulative count of Article Views (full-text article views including HTML views, PDF and ePub downloads, according to the available data) and Abstracts Views on Vision4Press platform.
Data correspond to usage on the plateform after 2015. The current usage metrics is available 48-96 hours after online publication and is updated daily on week days.
Initial download of the metrics may take a while.