Fig. 10.
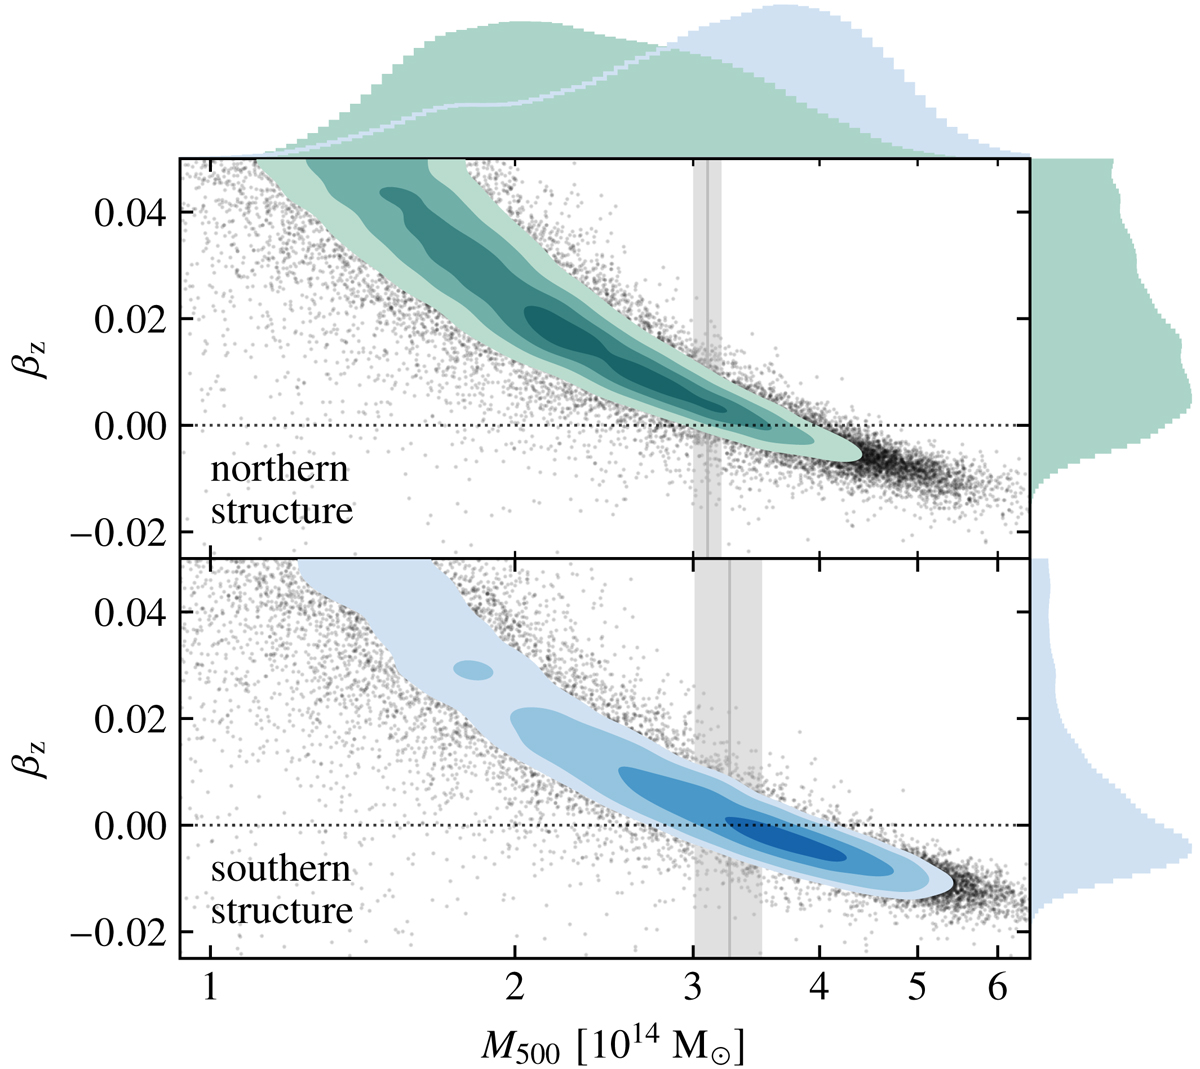
Marginalized posterior for the parameters corresponding to masses and line-of-sight peculiar velocities of the two SZ features (Sect. 3.2.3). The contours correspond to the same significance levels used in Fig. 8. Due to the limited spectral coverage and sensitivity of the ALMA+ACA data, it was not possible to derive tight constraints on the potential line-of-sight motion of the ICM features identified through the SZ analysis. The gray lines and shaded bands correspond to the mass estimates obtained in Sect. 3.2.3 under the assumption of a universal pressure profile (Arnaud et al. 2010).
Current usage metrics show cumulative count of Article Views (full-text article views including HTML views, PDF and ePub downloads, according to the available data) and Abstracts Views on Vision4Press platform.
Data correspond to usage on the plateform after 2015. The current usage metrics is available 48-96 hours after online publication and is updated daily on week days.
Initial download of the metrics may take a while.