Fig. 9.
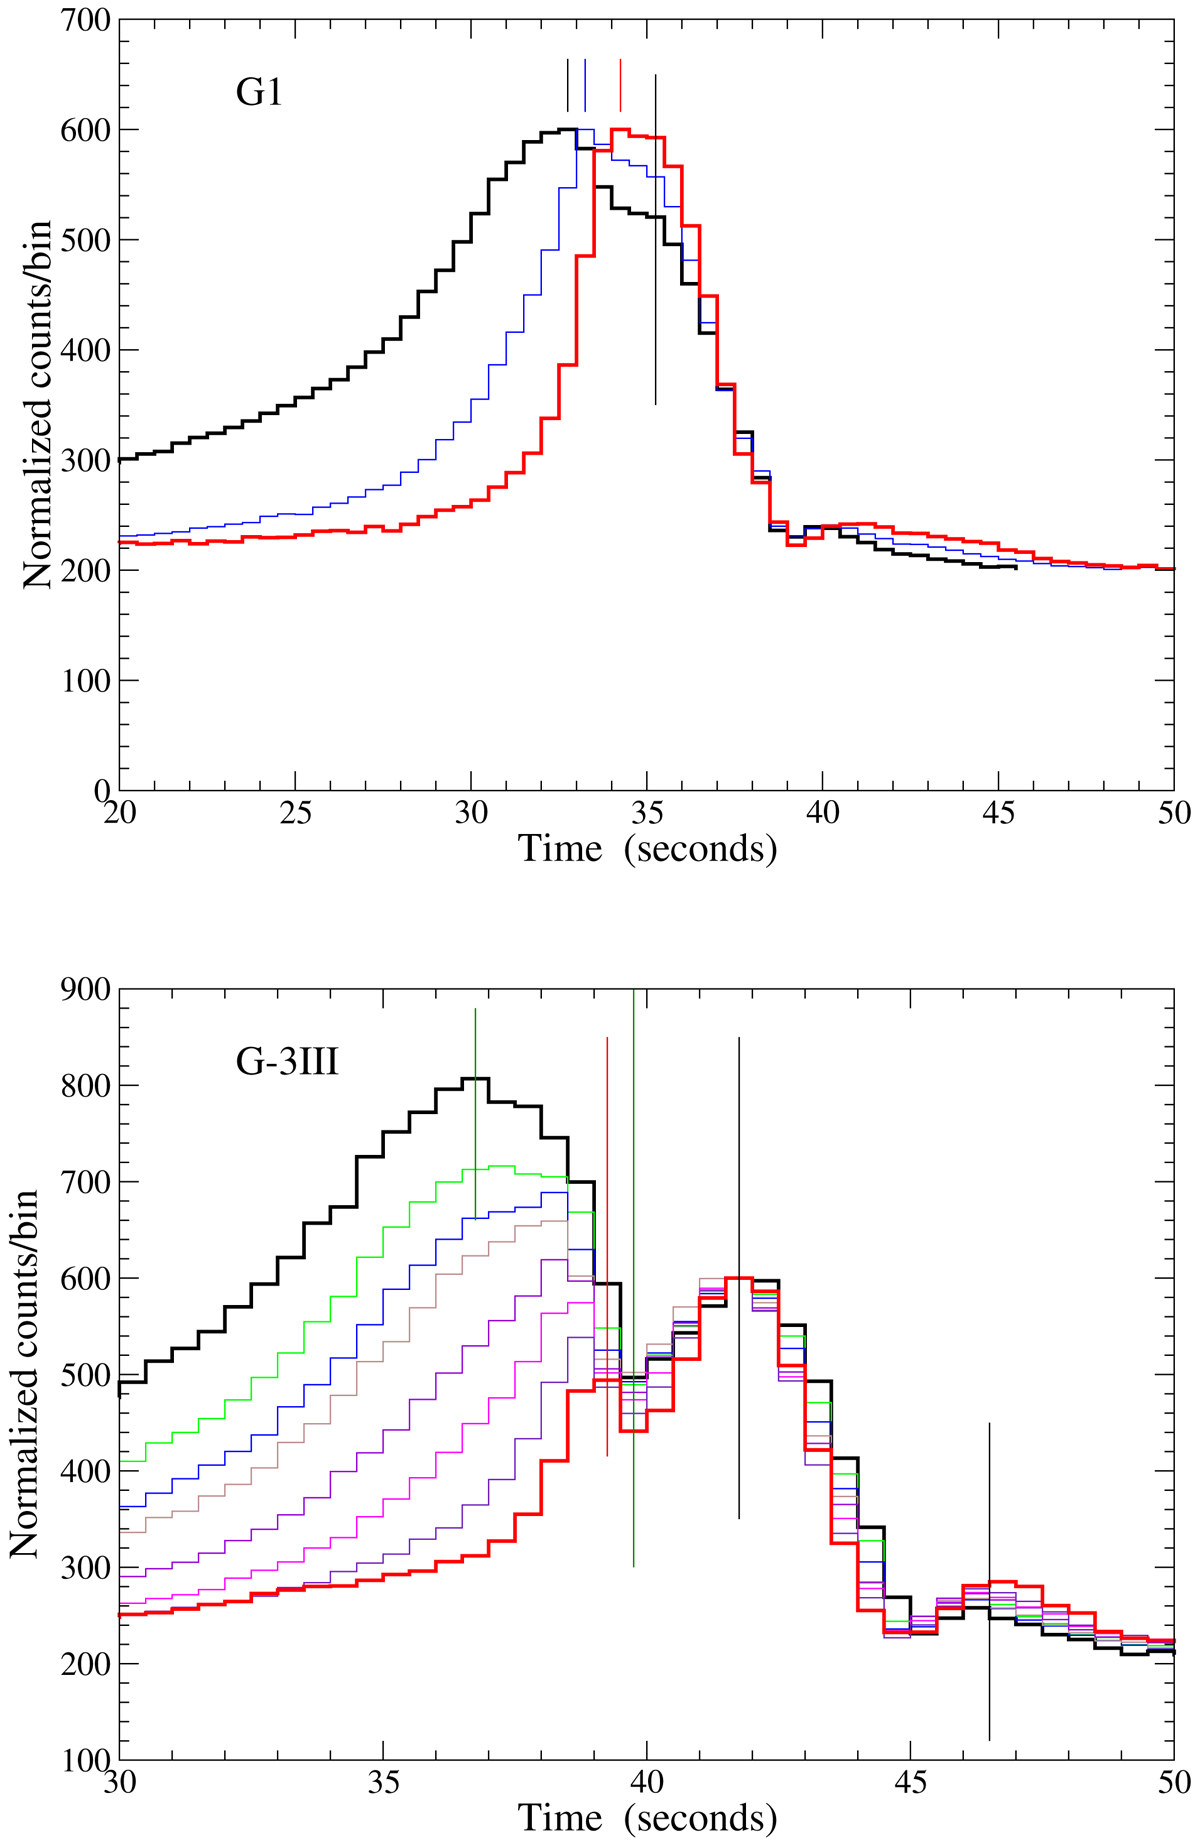
Segments of normalized mean profiles. In the upper panel three normalized mean profiles of the G-1 bursts at the energies of 2.5 (thick black line), 7.5 (thin blue line), and 12.5 keV (red thick line) are shown. Short vertical lines mark the maxima of P1 and the long vertical line marks the shoulder. The lower panel presents segments of normalized mean profiles of the G-3III bursts in some energy channels from the lowest (3.5 keV, thick black line) to the highest one (14.4 keV, red thick line). Long vertical lines mark the maxima of P2 and the minima in valley between P1 and P2; short vertical lines mark the maxima of P1 at the extreme energies. We note the constant time distance between the minimum between P1 and P2, the maxima of P2 and P3, while the time of the P1 maximum shifts by 2.5 s.
Current usage metrics show cumulative count of Article Views (full-text article views including HTML views, PDF and ePub downloads, according to the available data) and Abstracts Views on Vision4Press platform.
Data correspond to usage on the plateform after 2015. The current usage metrics is available 48-96 hours after online publication and is updated daily on week days.
Initial download of the metrics may take a while.