Fig. 8.
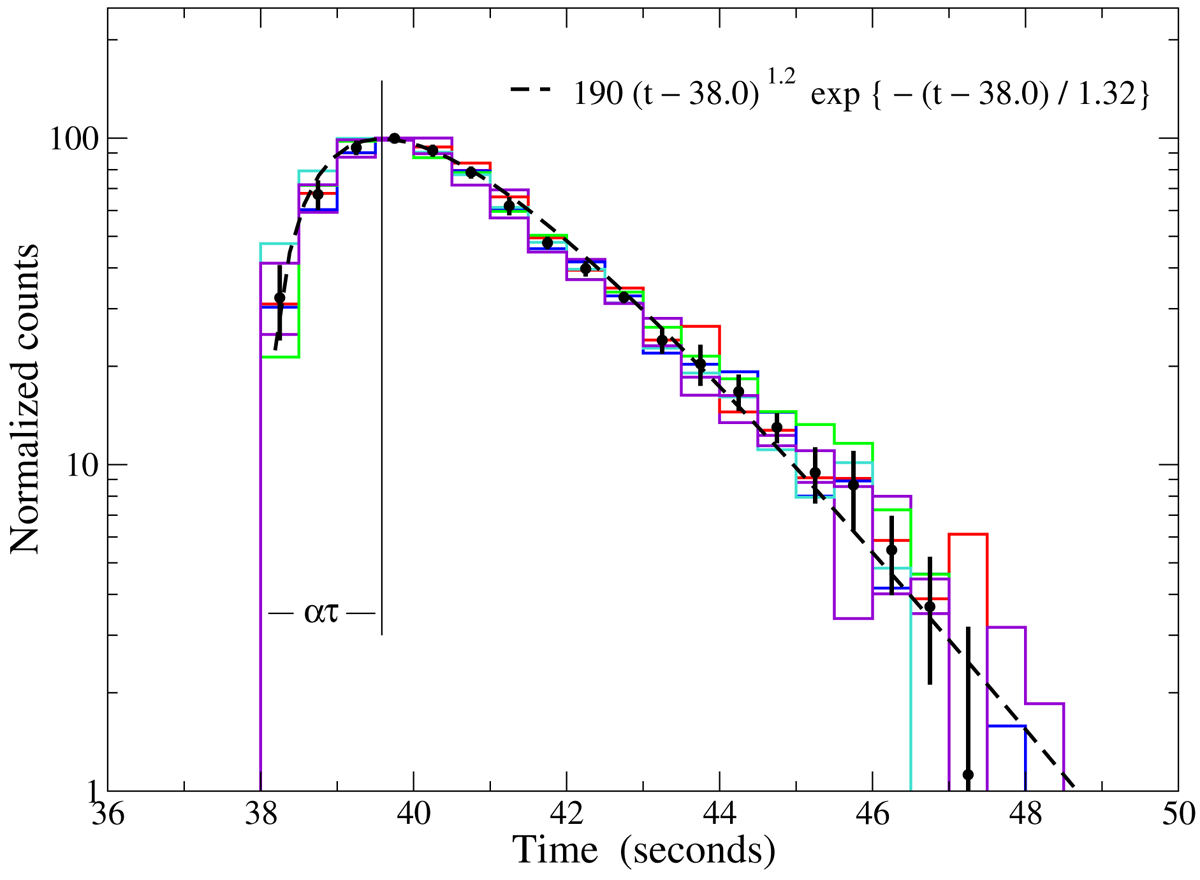
Comparison of five mean profiles of P3 from the G-3III observation in the energy channels in the band [6.8–14.4] keV, normalized in amplitude assuming the maxima equal to 100. Black filled circles are the mean values and the error is the dispersion of these values and the dashed line is the plot of the given best fit formula. The black vertical line indicates the position of the maximum computed applying the same best fit law.
Current usage metrics show cumulative count of Article Views (full-text article views including HTML views, PDF and ePub downloads, according to the available data) and Abstracts Views on Vision4Press platform.
Data correspond to usage on the plateform after 2015. The current usage metrics is available 48-96 hours after online publication and is updated daily on week days.
Initial download of the metrics may take a while.