Fig. 7.
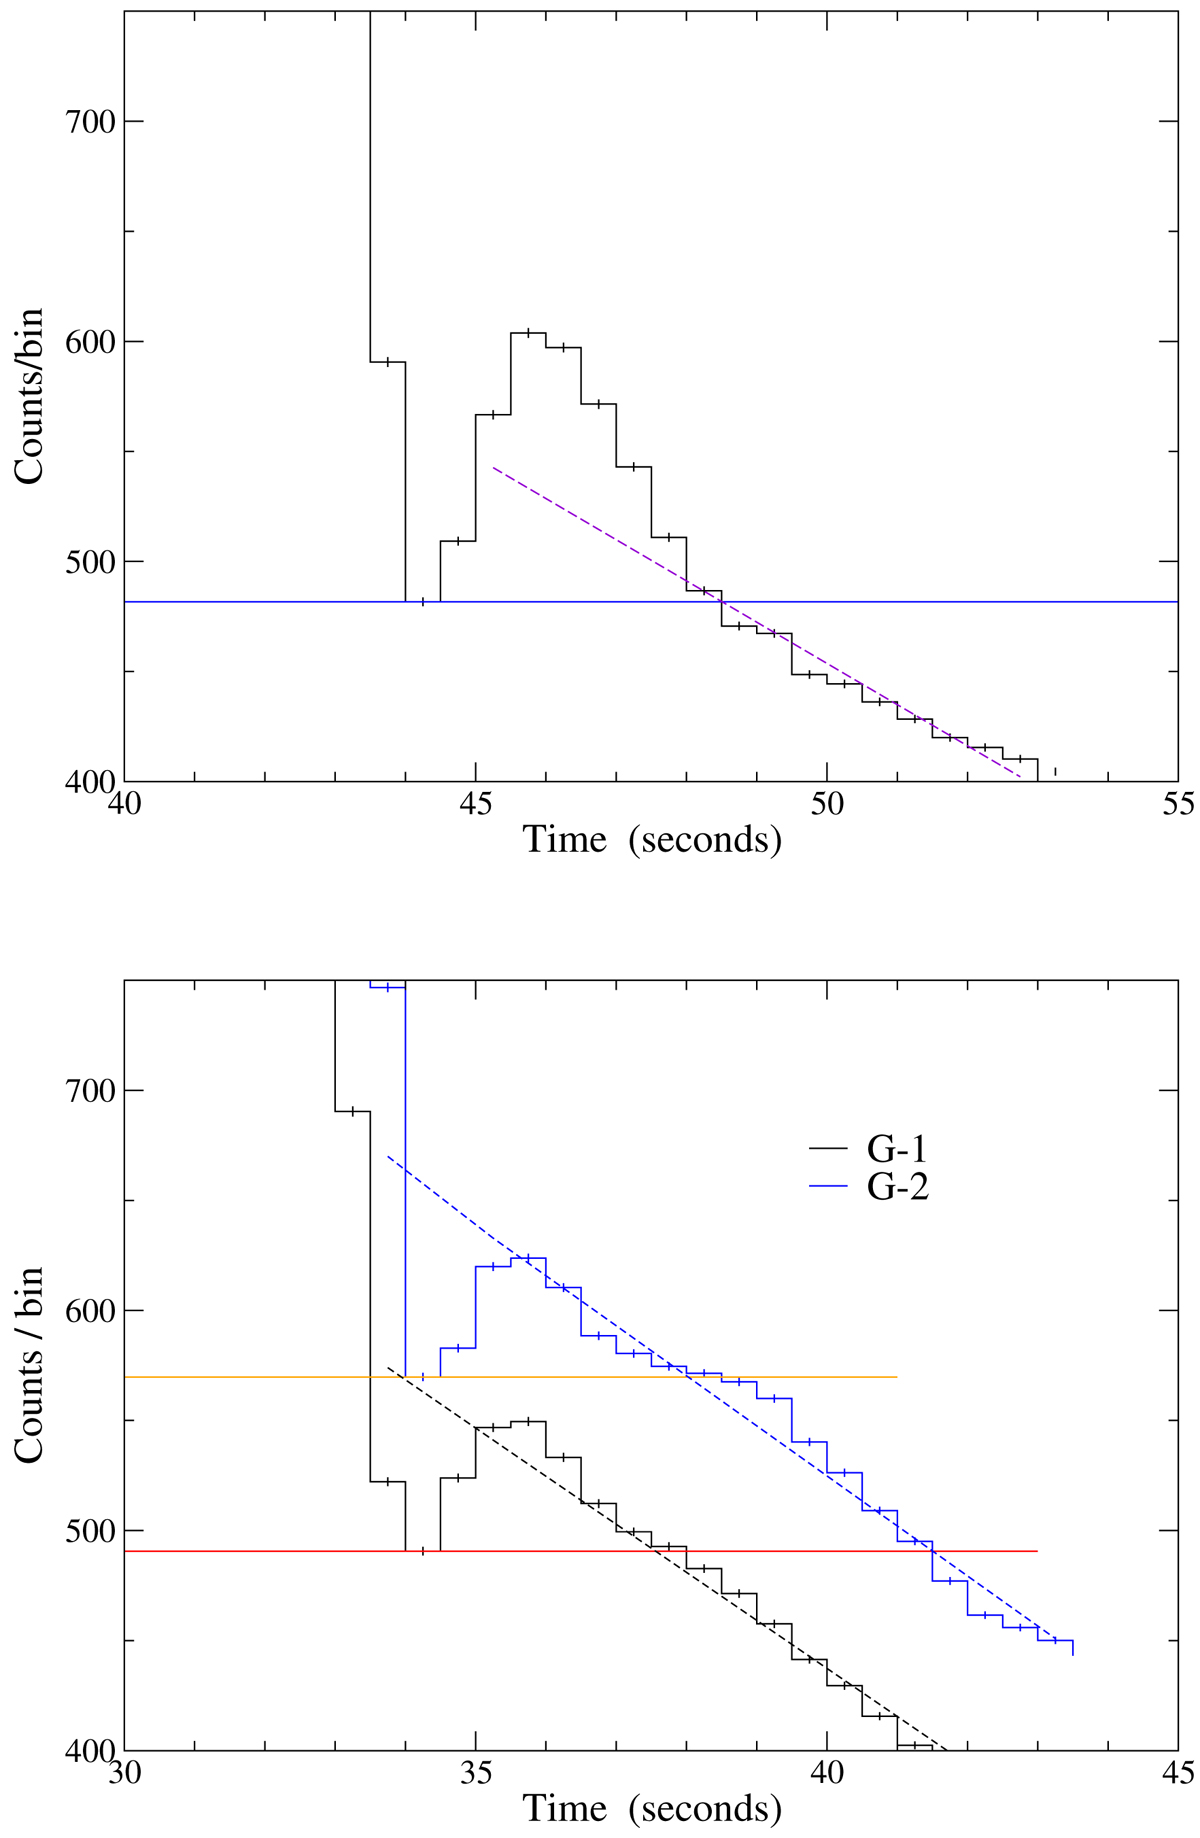
Mean burst profile of the structure of the P3 feature in the three observations. The upper panel is relative to G-3 data in the energy range [9.1–15.1] keV. The blue line defines the constant level used for computing the excess and statistical errors in each bin (0.5 s width) are reported, the dashed line is the linear extrapolation of the last two bins along the P3 profile. In the lower panel profiles relative to G-1 and G-2 are shown, with the energy ranges corresponding to the five highest energy channels: [8.6–13.0] and [7.8–12.9] keV, respectively.
Current usage metrics show cumulative count of Article Views (full-text article views including HTML views, PDF and ePub downloads, according to the available data) and Abstracts Views on Vision4Press platform.
Data correspond to usage on the plateform after 2015. The current usage metrics is available 48-96 hours after online publication and is updated daily on week days.
Initial download of the metrics may take a while.