Free Access
Fig. 5.
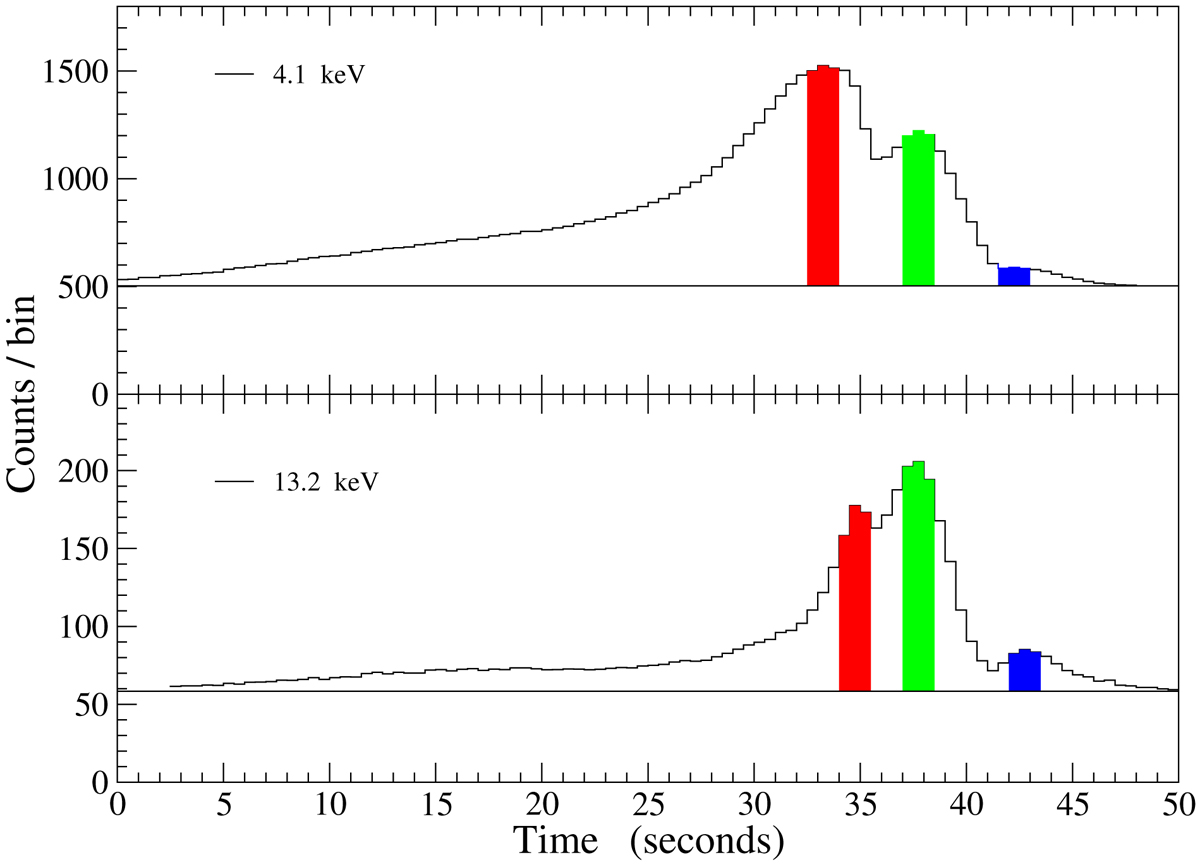
Two mean profiles at different energies of the G-3 data set. The three bins that are indicated as wide, colored areas are the ones used for computing the peak amplitudes ratios.
Current usage metrics show cumulative count of Article Views (full-text article views including HTML views, PDF and ePub downloads, according to the available data) and Abstracts Views on Vision4Press platform.
Data correspond to usage on the plateform after 2015. The current usage metrics is available 48-96 hours after online publication and is updated daily on week days.
Initial download of the metrics may take a while.