Fig. 4.
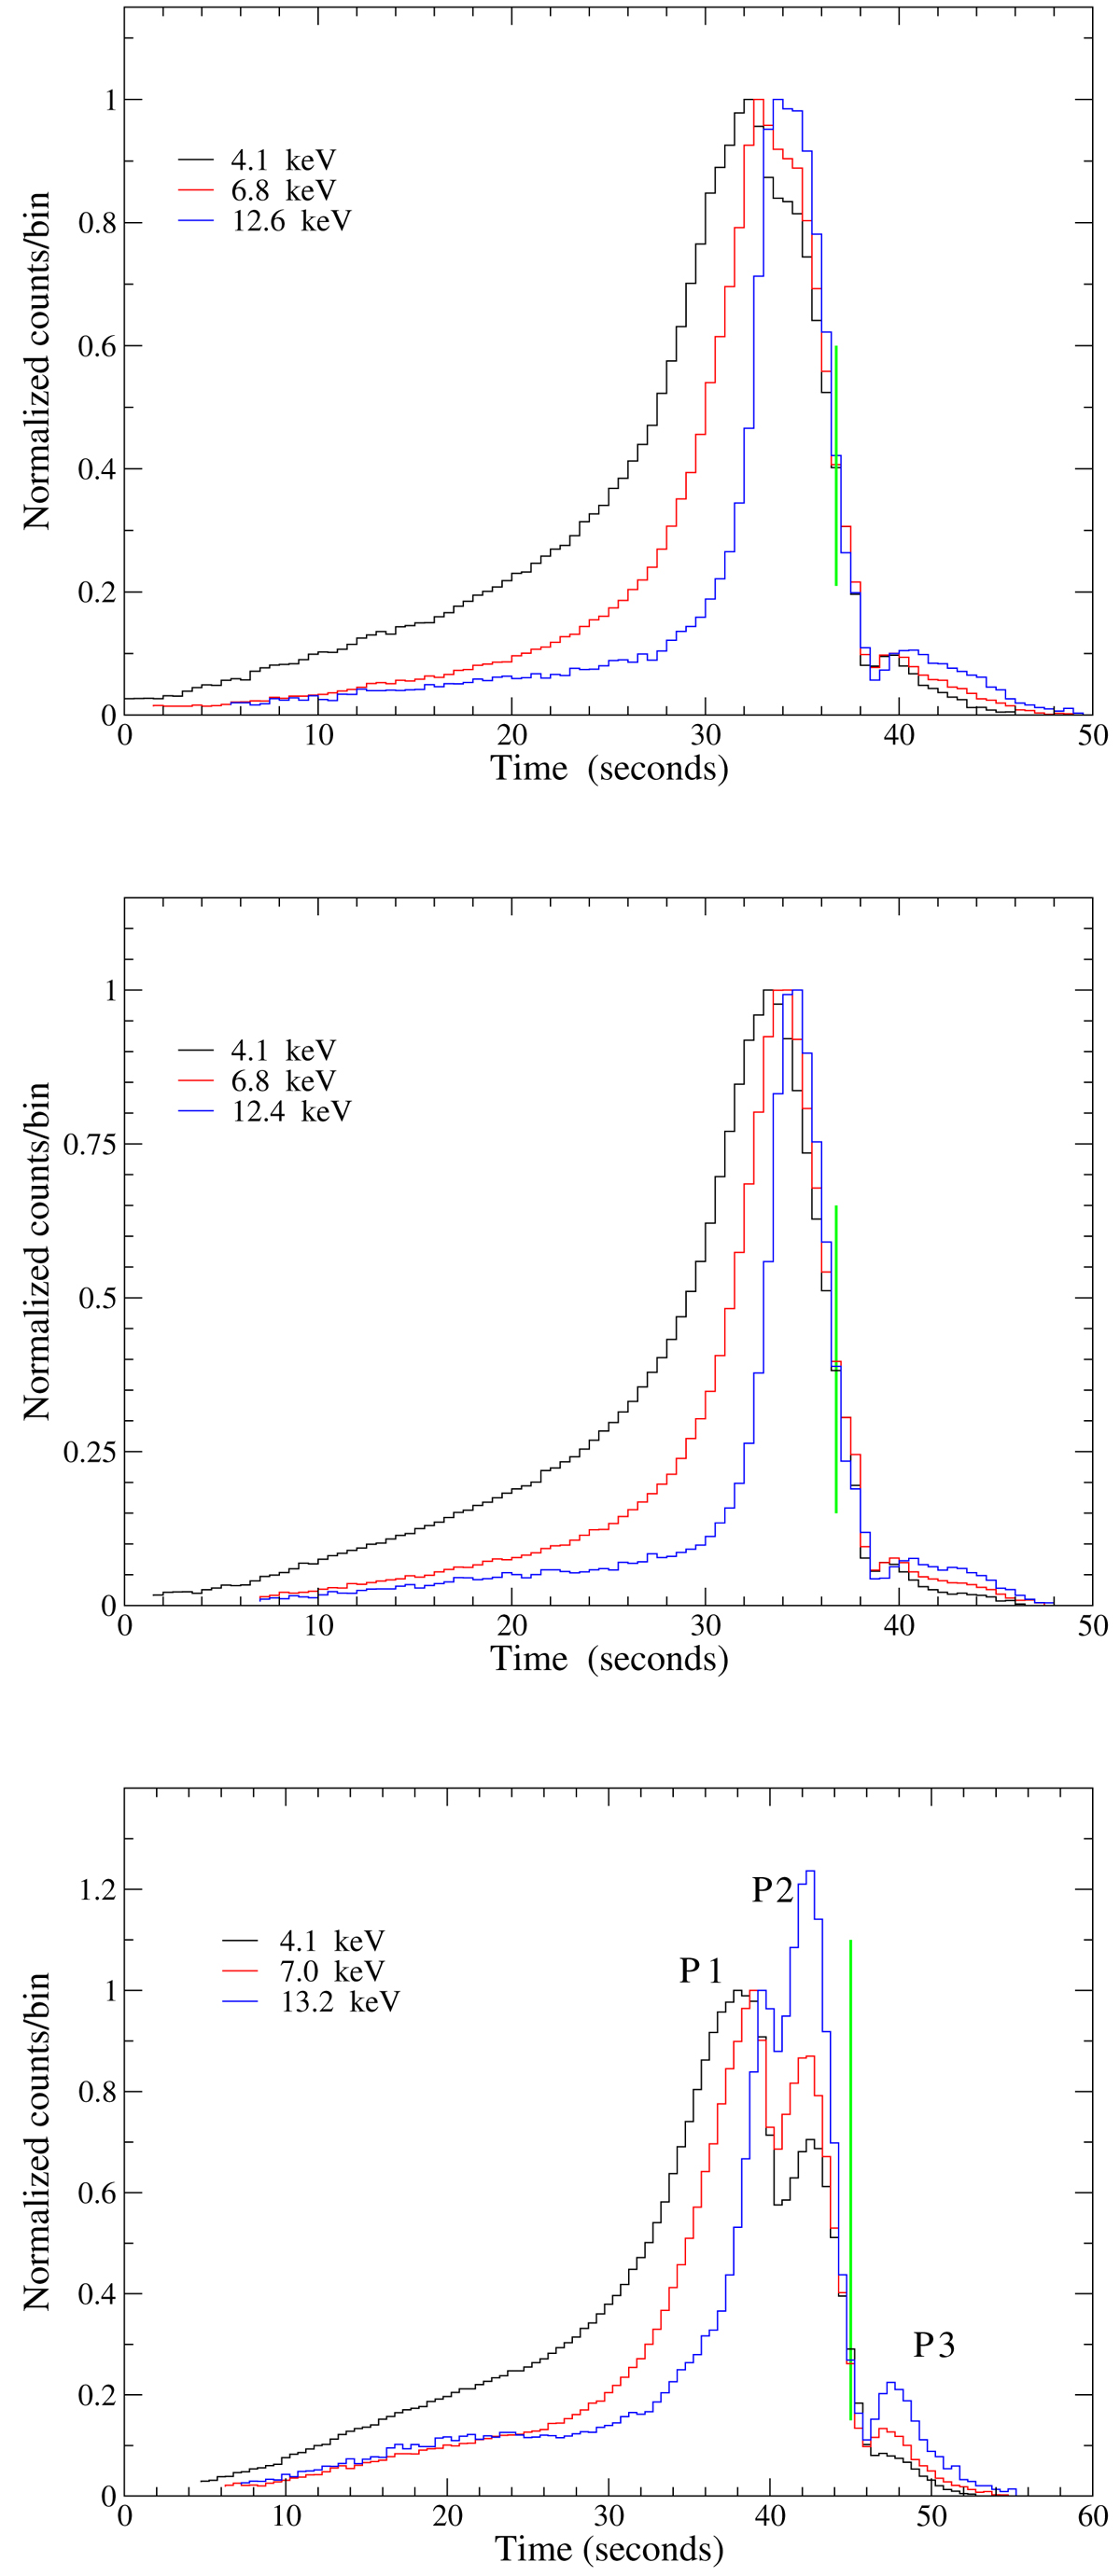
Normalized mean pulse profiles in three energy channels. Individual bursts are aligned at the point of the decay portion marked by the green vertical lines. The time binning is 0.5 s. Top panel: mean profiles for the G-1 data. Central panel: mean profiles for the G-2 data. Bottom panel: mean profiles for the G-3 data. The three peaks, P1, P2, and P3, are indicated with labels.
Current usage metrics show cumulative count of Article Views (full-text article views including HTML views, PDF and ePub downloads, according to the available data) and Abstracts Views on Vision4Press platform.
Data correspond to usage on the plateform after 2015. The current usage metrics is available 48-96 hours after online publication and is updated daily on week days.
Initial download of the metrics may take a while.