Free Access
Fig. 2.
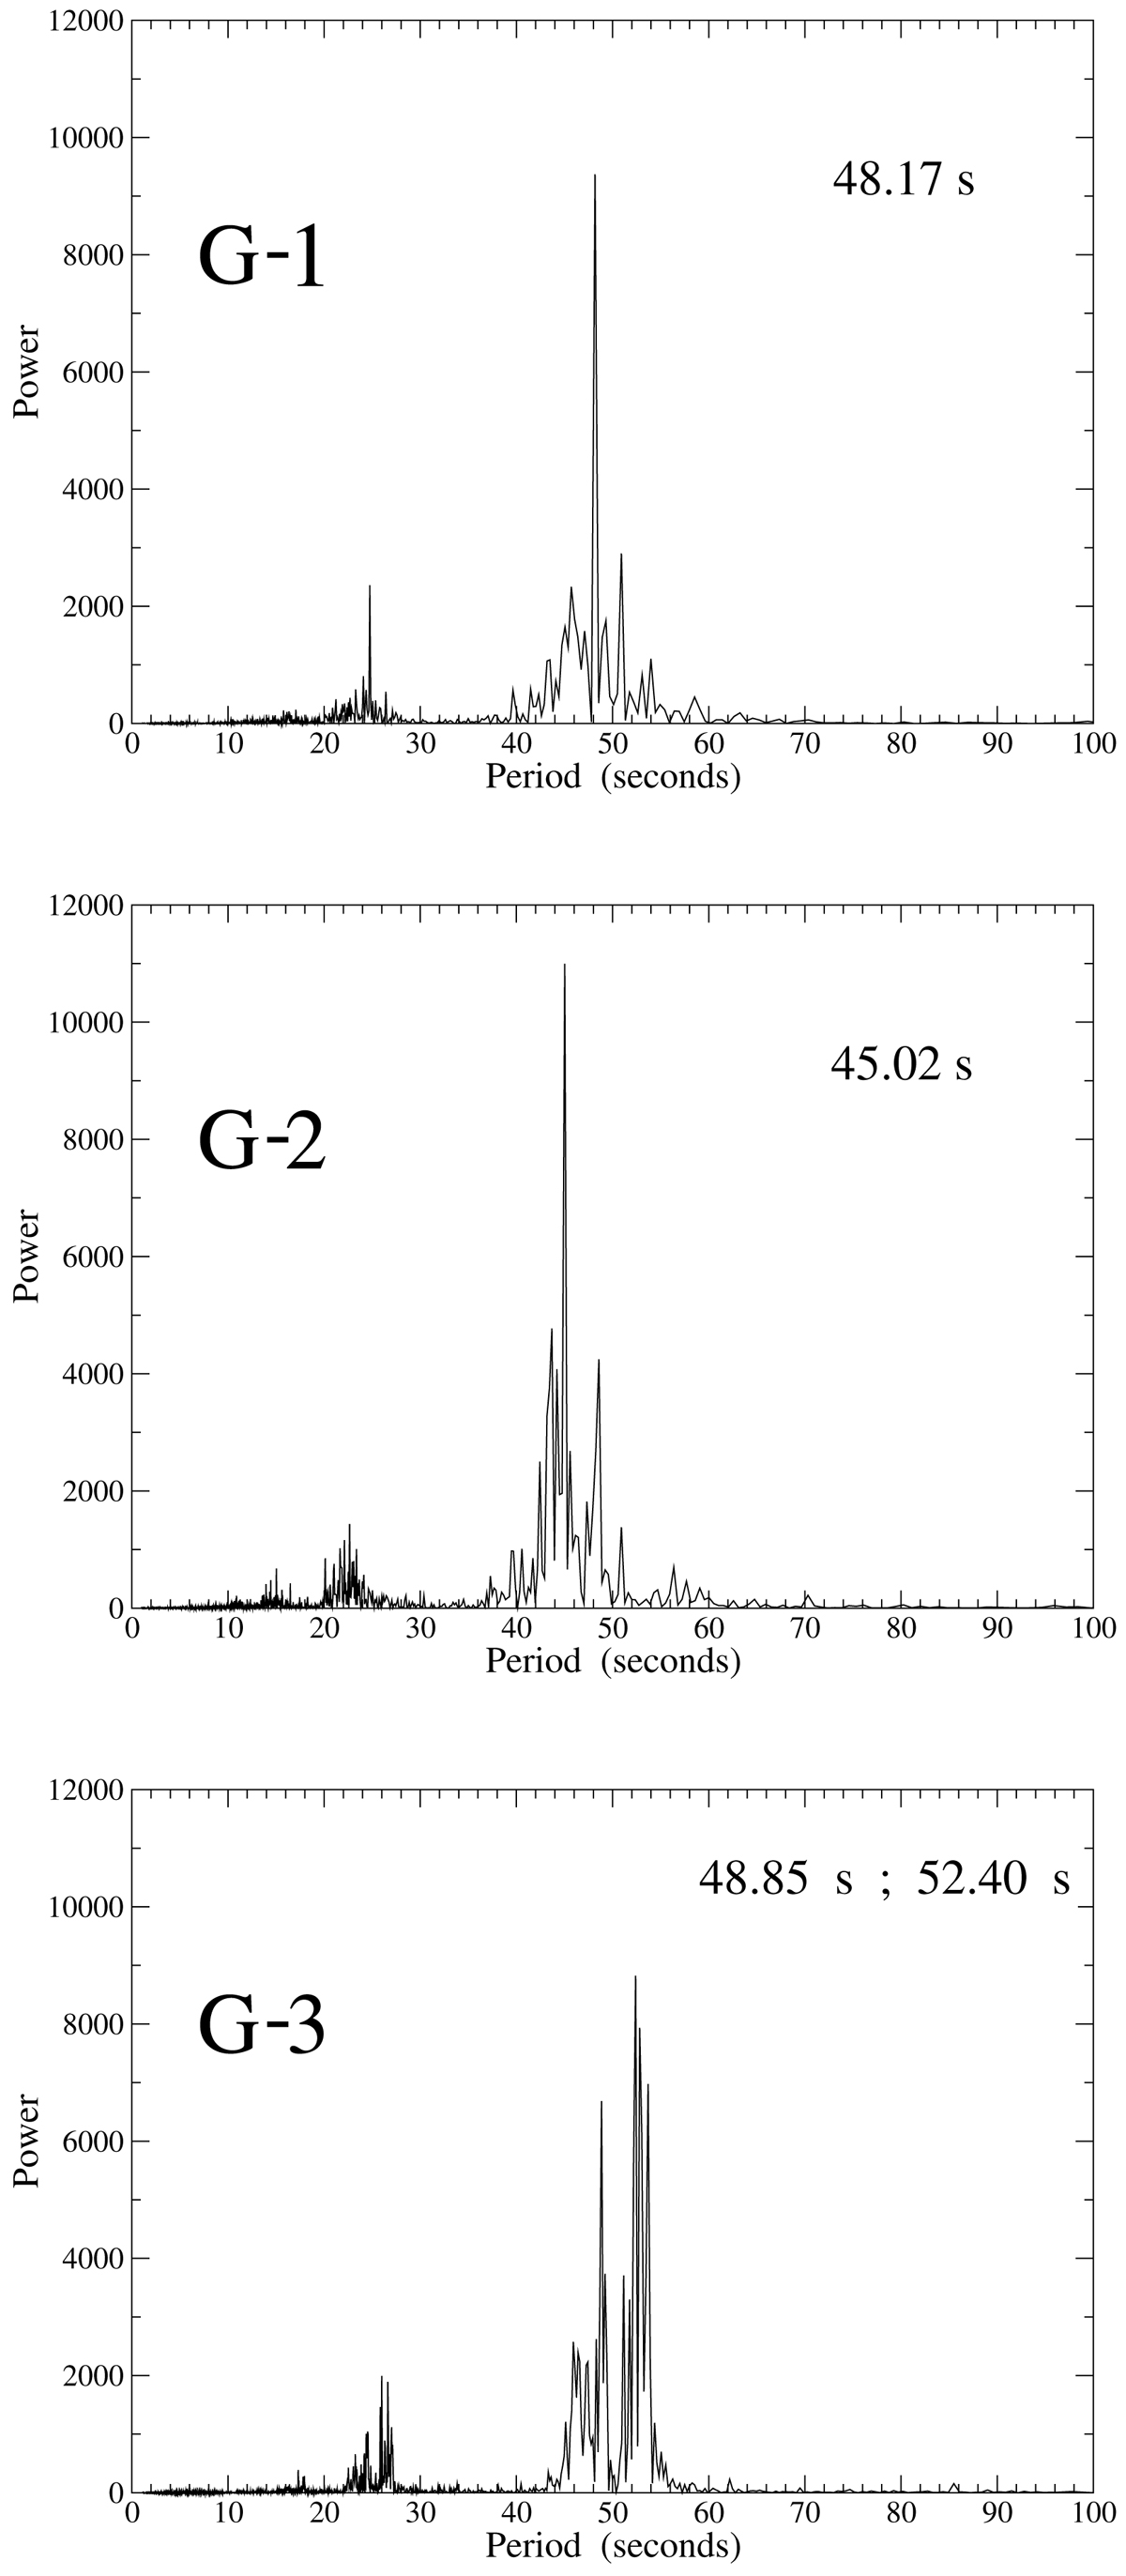
Fourier periodogram of the entire observations at the energy of 4.1 keV with a time bin size of 0.5 s. The plot in the top panel is relative to G-1, that in the central panel to G-2 and the one in the bottom panel to G-3. The period values corresponding to the peaks are reported here.
Current usage metrics show cumulative count of Article Views (full-text article views including HTML views, PDF and ePub downloads, according to the available data) and Abstracts Views on Vision4Press platform.
Data correspond to usage on the plateform after 2015. The current usage metrics is available 48-96 hours after online publication and is updated daily on week days.
Initial download of the metrics may take a while.