Free Access
Fig. A.1.
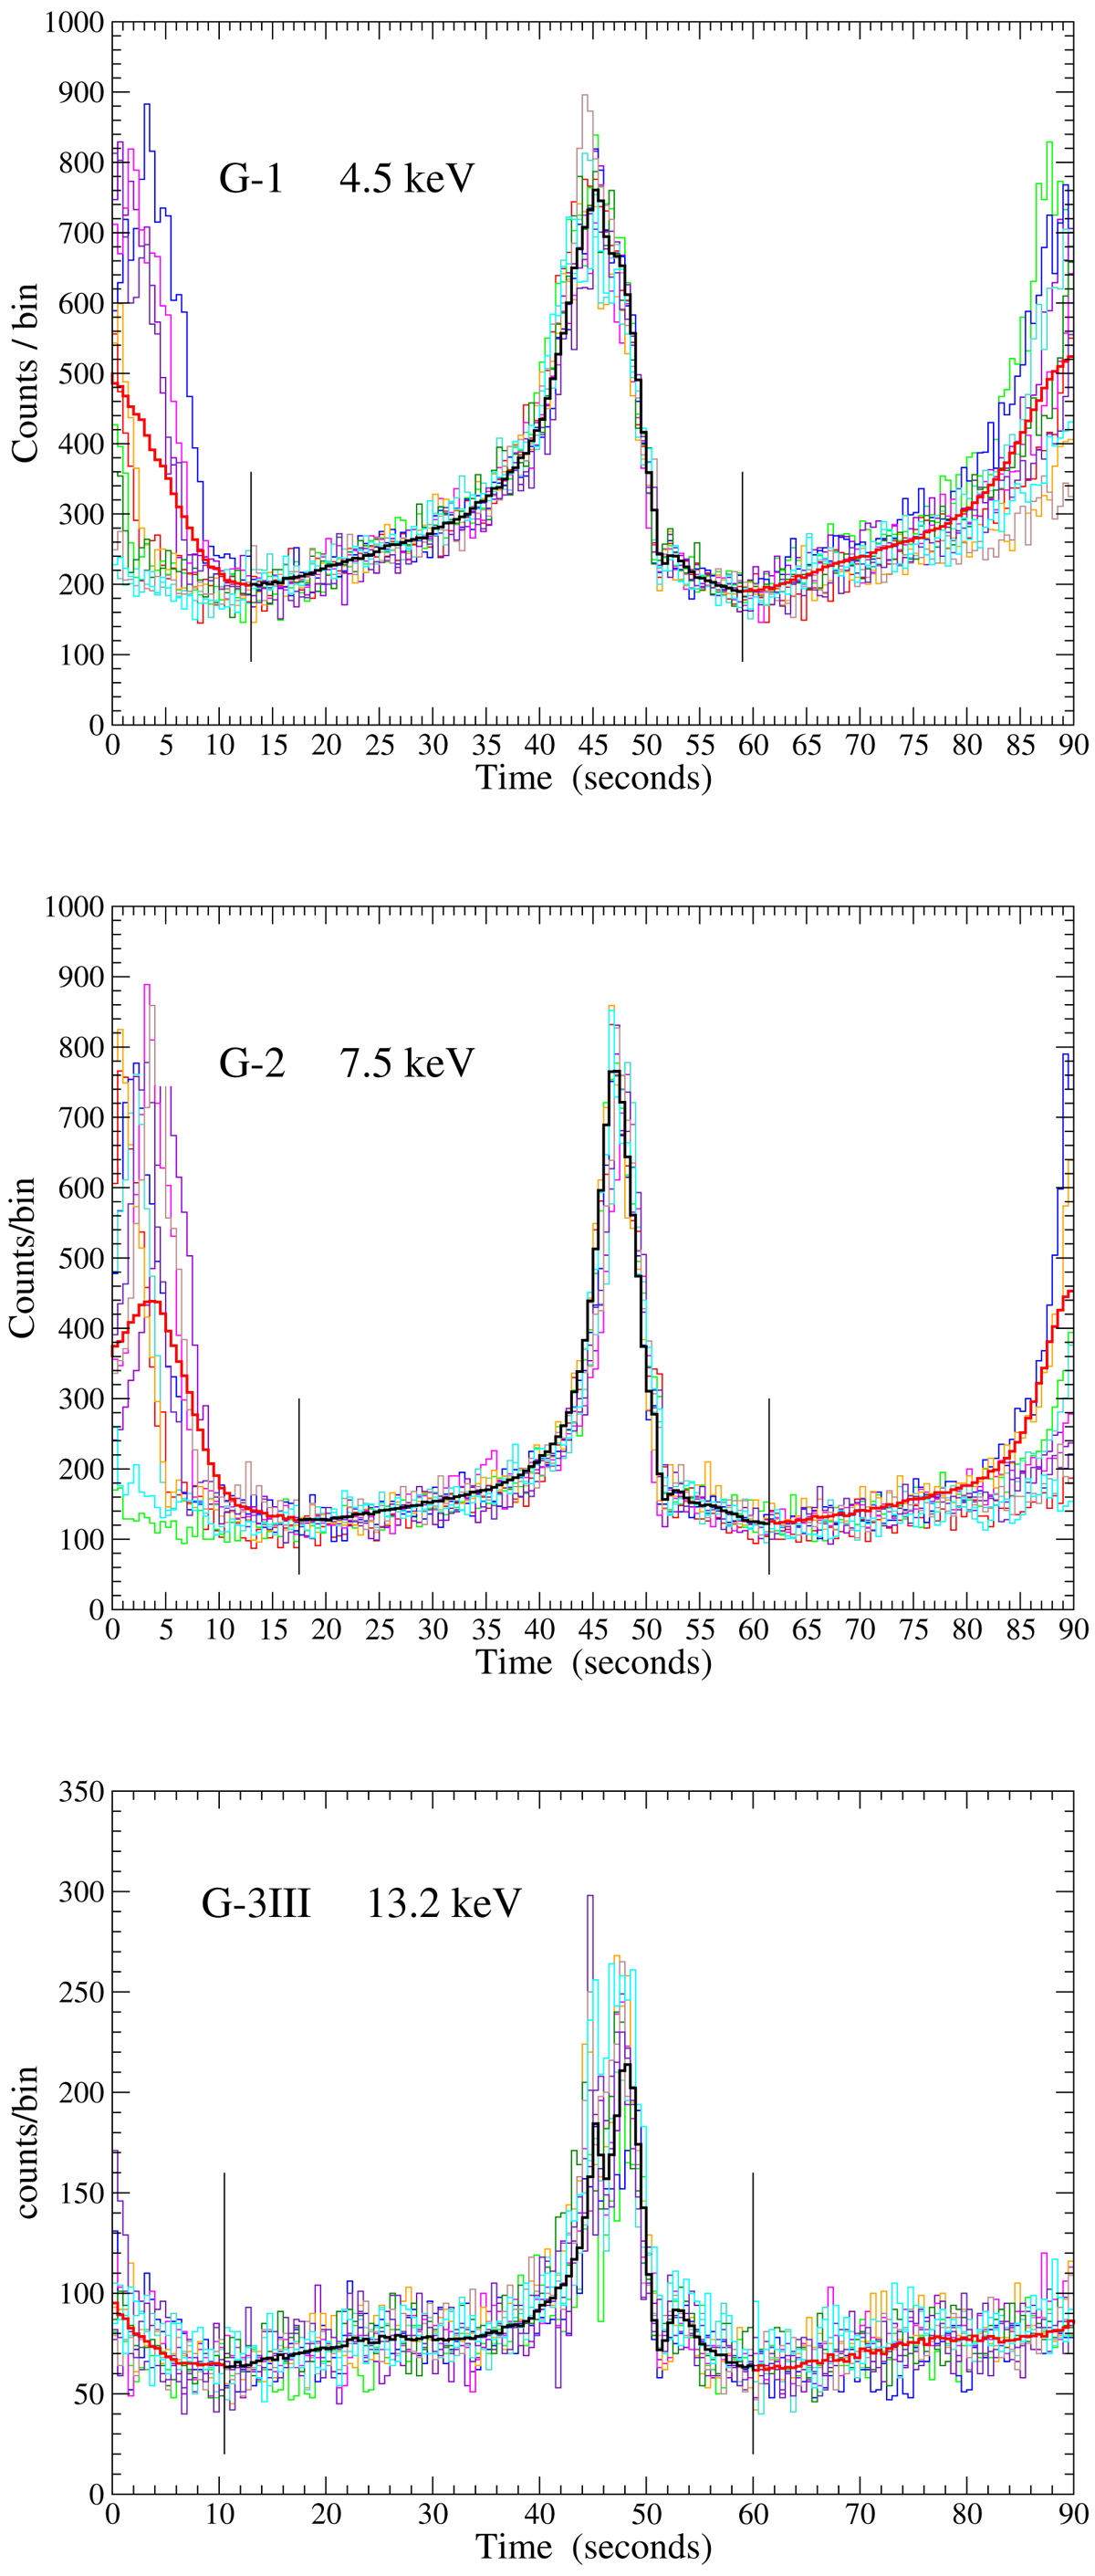
Mean profile (thick black line) obtained as outputs of our averaging method with only twelve superposed bursts (colored histograms). The top panel is relative to the G-1 data series at 4.5 keV, the central panel to the G-2 observation at 7.5 keV and the bottom panel to the G-3III observation at 13.2 keV.
Current usage metrics show cumulative count of Article Views (full-text article views including HTML views, PDF and ePub downloads, according to the available data) and Abstracts Views on Vision4Press platform.
Data correspond to usage on the plateform after 2015. The current usage metrics is available 48-96 hours after online publication and is updated daily on week days.
Initial download of the metrics may take a while.