Fig. 12.
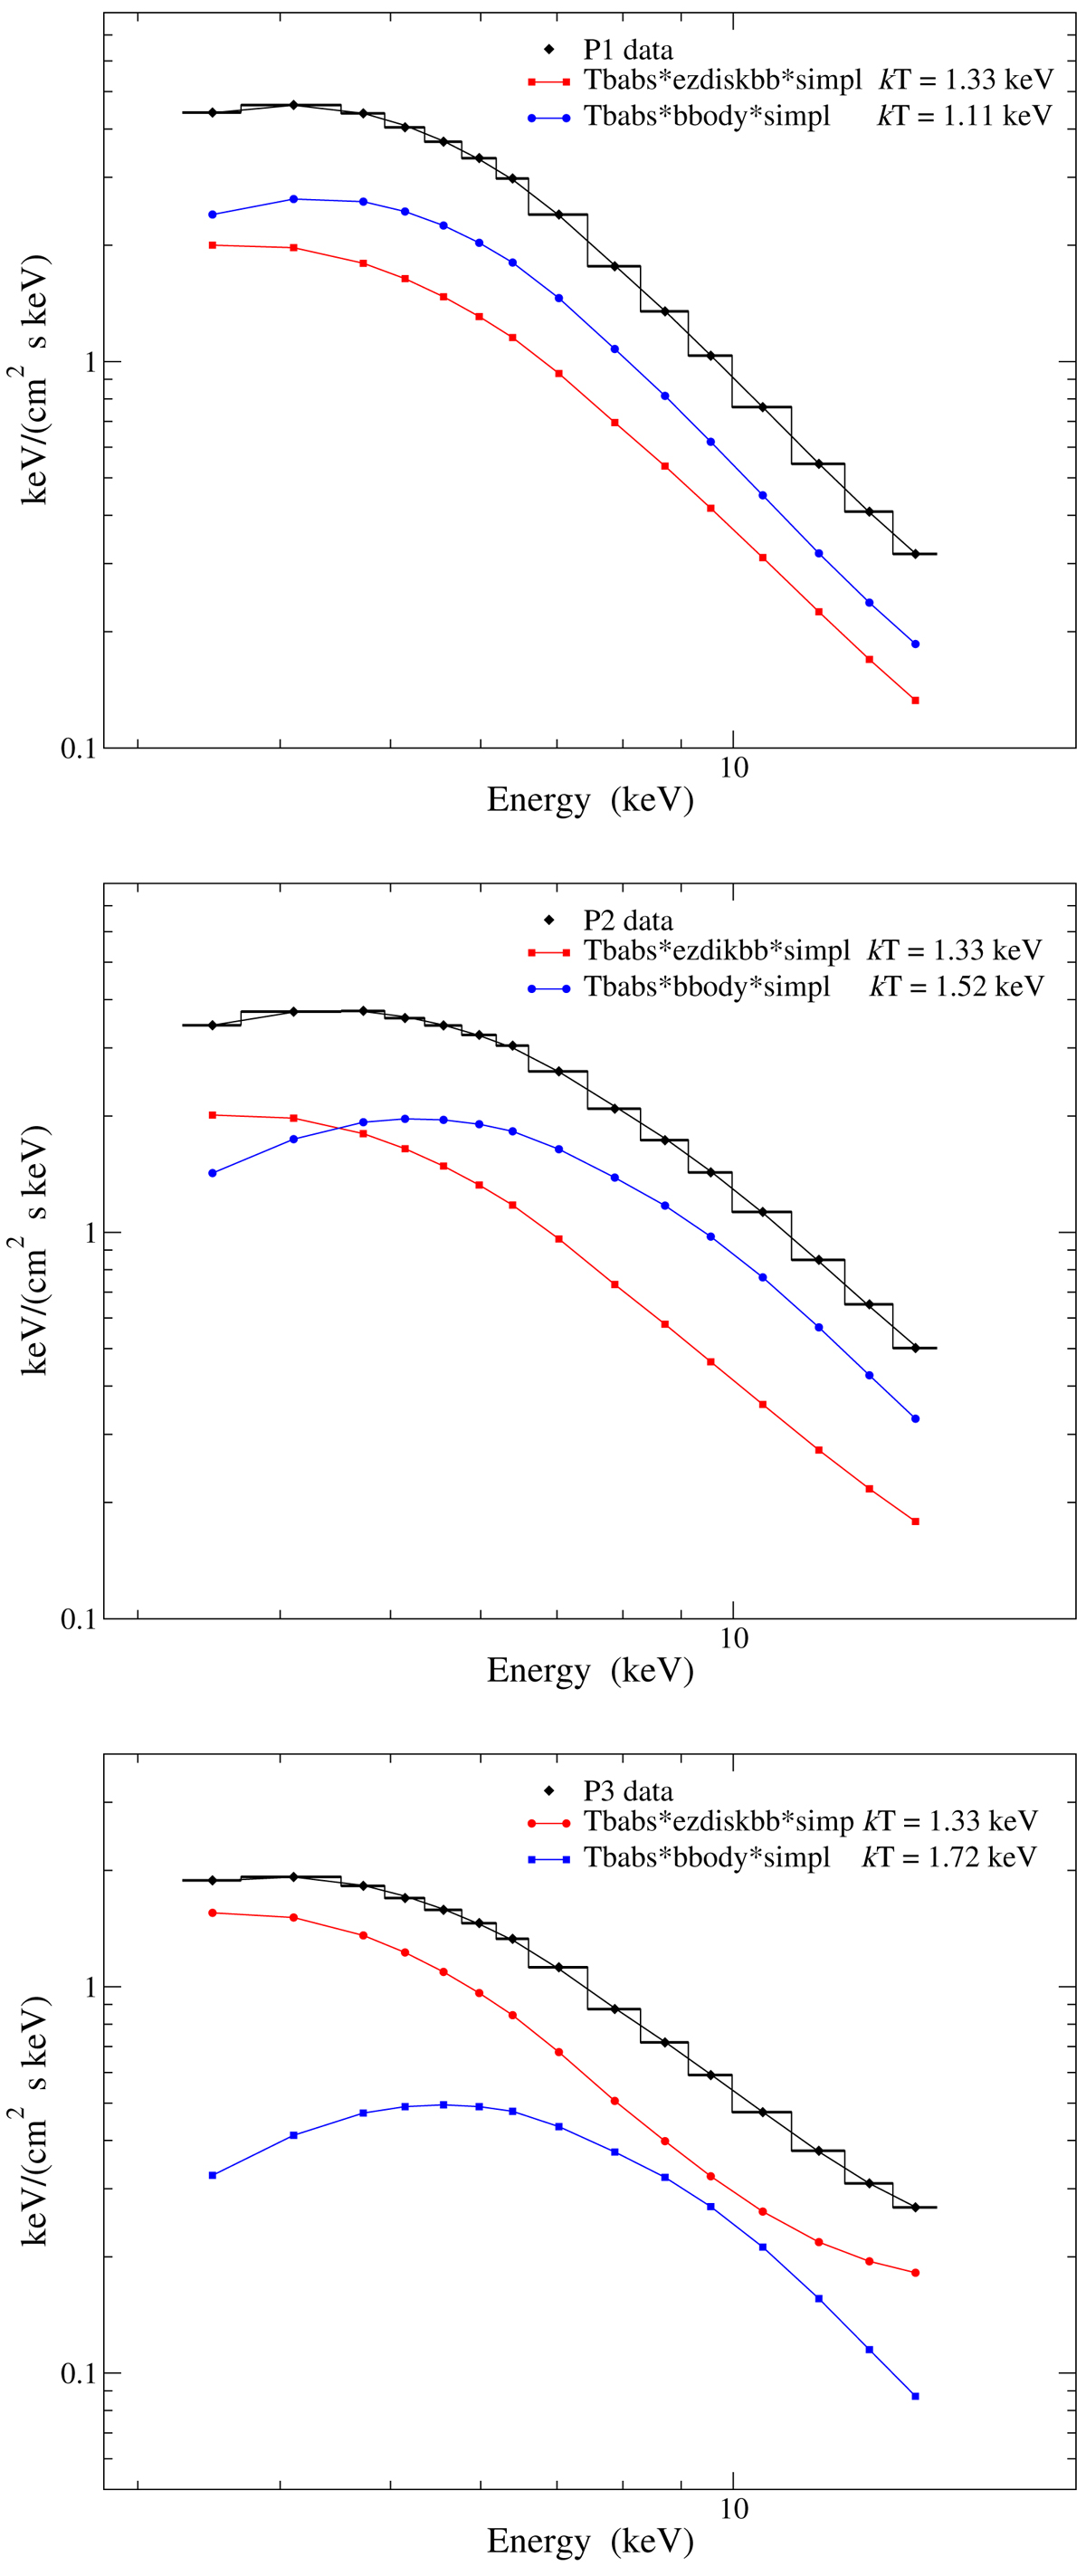
Best-fit spectral components of the three peaks of the G-3III data set, including the low energy absorption and the Comptonization to a power law. We note the increasing blackbody temperature from P1 to P3. Statistical uncertainties of the data are two orders of magnitude lower the values and are not visible in these plots. Top panel: black diamonds and deconvolved data for P1 and the black solid line is the total flux resulting from the sum of the EZDISKBB (red) and BBODY (blue) lines; central panel: same model for P2; bottom panel: same model for P3; we note the high energy flattening due to the Compton scattered photons.
Current usage metrics show cumulative count of Article Views (full-text article views including HTML views, PDF and ePub downloads, according to the available data) and Abstracts Views on Vision4Press platform.
Data correspond to usage on the plateform after 2015. The current usage metrics is available 48-96 hours after online publication and is updated daily on week days.
Initial download of the metrics may take a while.