Free Access
Fig. 11.
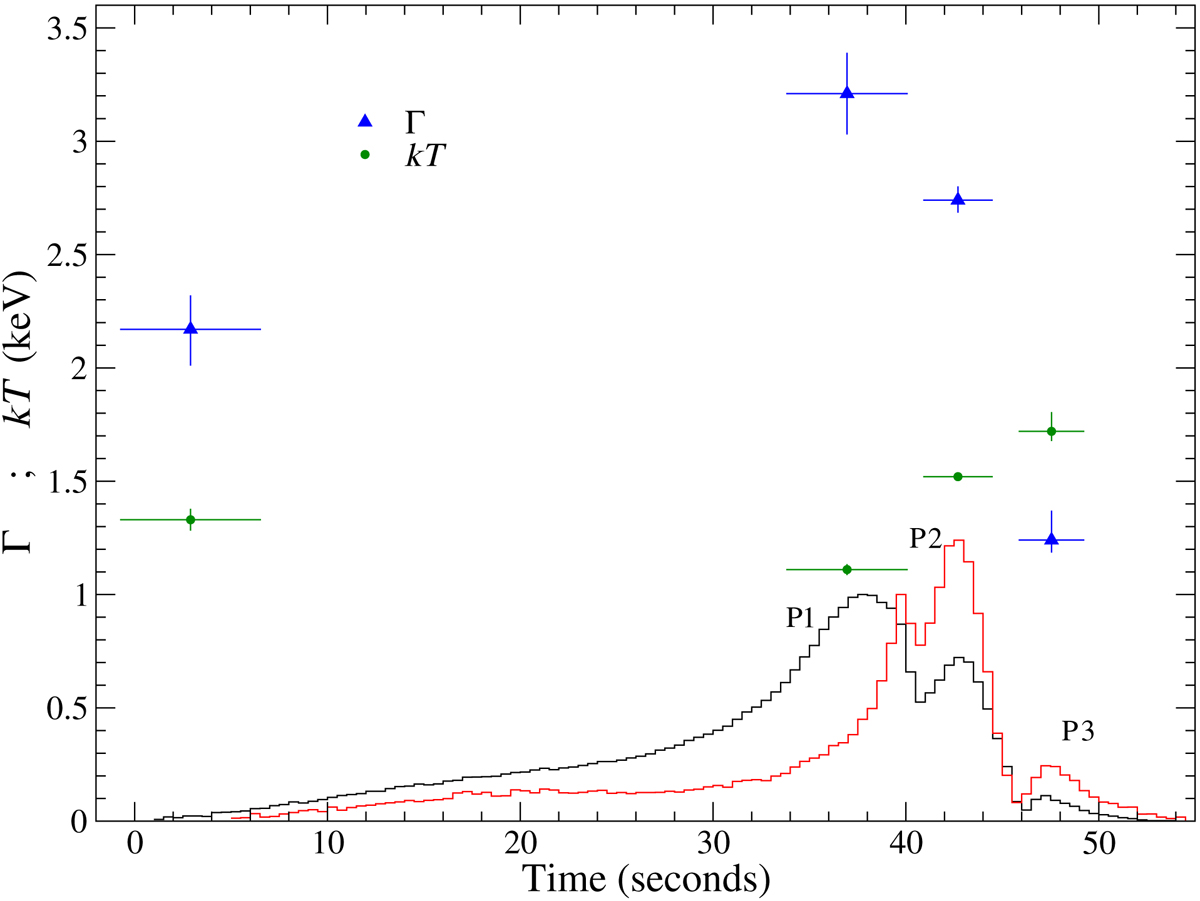
Best-fit values of kT (dark green filled circles) and Γ (blue filled triangles) of the BL and peak spectral best fits of the G-3III observation. Reported errors correspond to 1 standard deviation. Mean pulse profile at the energies of 4.1 (black) and 13.2 (red) keV to show the time correspondences are plotted.
Current usage metrics show cumulative count of Article Views (full-text article views including HTML views, PDF and ePub downloads, according to the available data) and Abstracts Views on Vision4Press platform.
Data correspond to usage on the plateform after 2015. The current usage metrics is available 48-96 hours after online publication and is updated daily on week days.
Initial download of the metrics may take a while.