Free Access
Fig. 10.
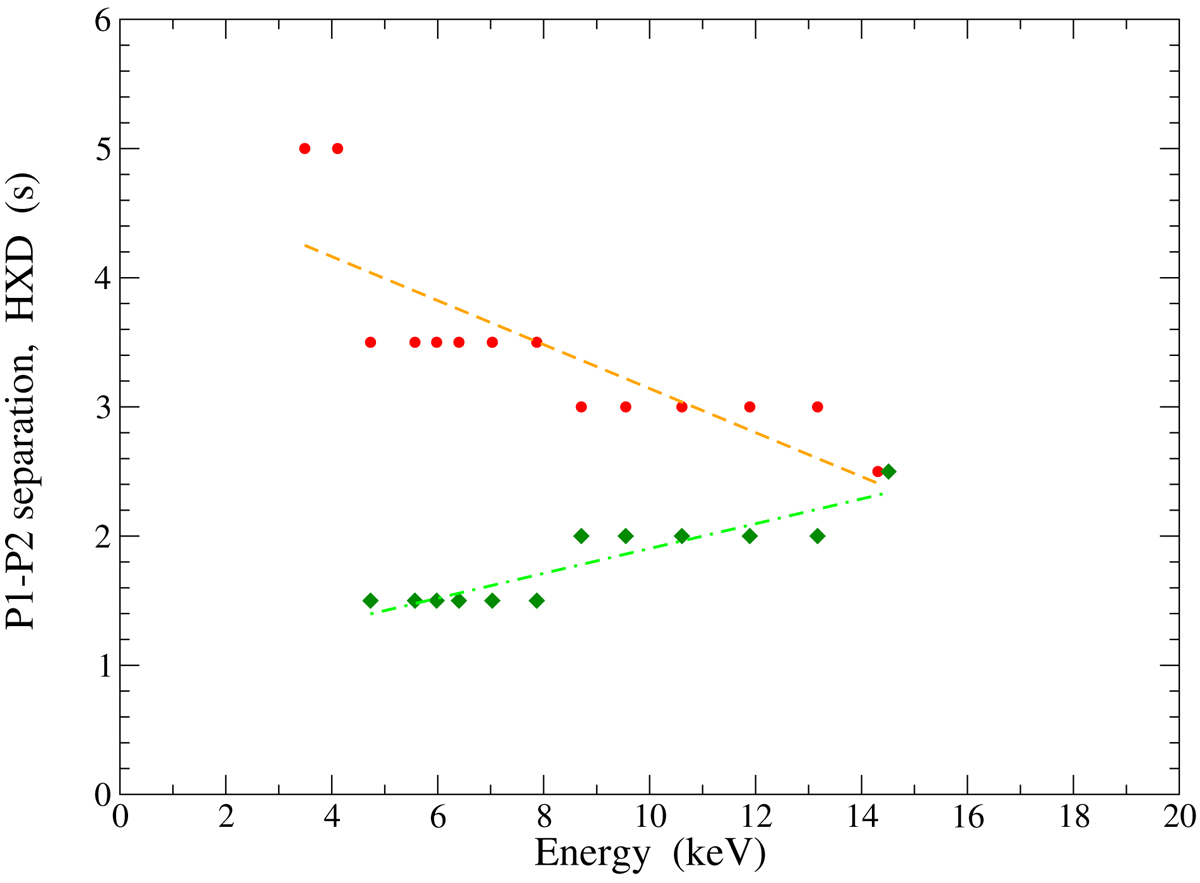
Time separation between the maxima of P2 and P1 (red filled circles) and the HXD (dark green filled diamond) of the G-3 data set. The dashed and the dot-dashed lines are the linear best fits to these sets.
Current usage metrics show cumulative count of Article Views (full-text article views including HTML views, PDF and ePub downloads, according to the available data) and Abstracts Views on Vision4Press platform.
Data correspond to usage on the plateform after 2015. The current usage metrics is available 48-96 hours after online publication and is updated daily on week days.
Initial download of the metrics may take a while.