Fig. 1.
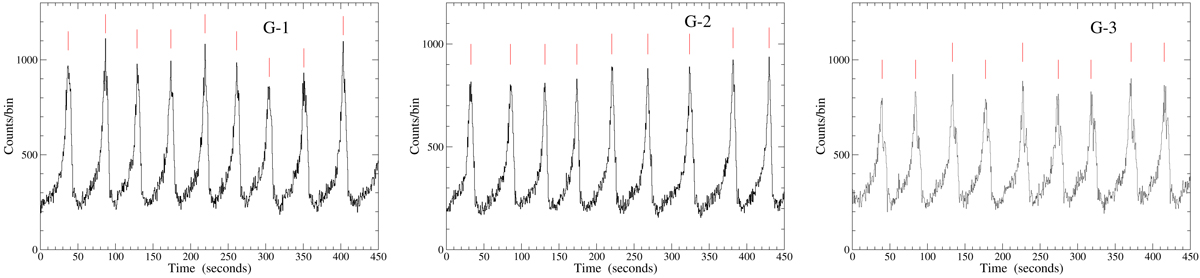
Segments of the observations at the energy of 4.1 keV with a time bin size of 0.5 s: G-1 observation is shown in the left panel, G-2 in the central panel, and G-3 in the right panel. The vertical red lines mark the position of the maxima to better illustrate the variations in the duration of the bursts. We note that the time separation between vertical lines is not constant and that the peaks present different shapes in the three observations.
Current usage metrics show cumulative count of Article Views (full-text article views including HTML views, PDF and ePub downloads, according to the available data) and Abstracts Views on Vision4Press platform.
Data correspond to usage on the plateform after 2015. The current usage metrics is available 48-96 hours after online publication and is updated daily on week days.
Initial download of the metrics may take a while.