Fig. 8.
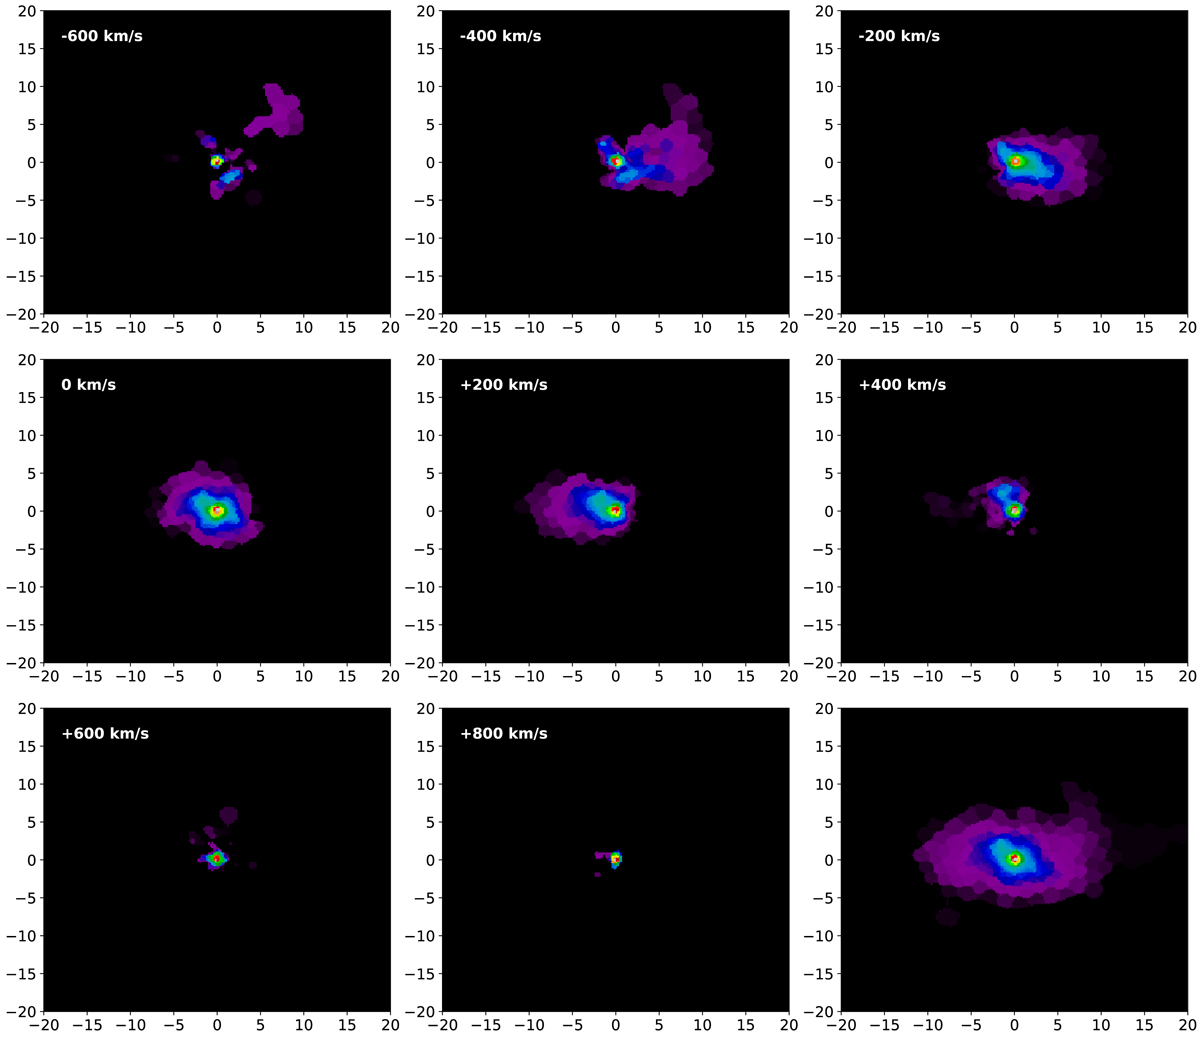
Tomography analysis of the [O III] 5007 Å emission. The maps show the [O III] emission integrated in velocity slices of 200 km s−1 each. Each panel shows the emission for a slice, with the central velocity of the slice (measured with respect to the systemic velocity) indicated in the top left corner. The last panel, in the bottom right corner, shows the summed emission from all the velocity slices. The images are in square root scale to highlight the high velocity emission from the nuclear regions. The size of each panel is 40 × 40 arcsec, with the x and y axis labels showing the arcsecond offset from the centre, as in Fig. 4.
Current usage metrics show cumulative count of Article Views (full-text article views including HTML views, PDF and ePub downloads, according to the available data) and Abstracts Views on Vision4Press platform.
Data correspond to usage on the plateform after 2015. The current usage metrics is available 48-96 hours after online publication and is updated daily on week days.
Initial download of the metrics may take a while.