Fig. 7.
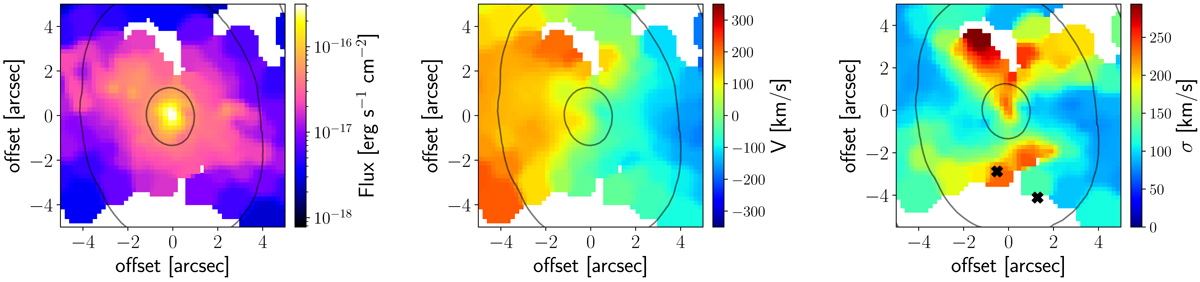
Maps of the [O III] distribution and dynamics. Panels show zoom-ins of the inner 10 × 10 arcsec2, and 10 arcsec corresponds to 2.2 kpc. From left to right: [O III] flux, velocity, and velocity dispersion. The overlaid grey contours show the galaxy light isophotes. The two black crosses in the right panel show the position of the two radio sources found by Filho et al. (2006). North is up, and east is left.
Current usage metrics show cumulative count of Article Views (full-text article views including HTML views, PDF and ePub downloads, according to the available data) and Abstracts Views on Vision4Press platform.
Data correspond to usage on the plateform after 2015. The current usage metrics is available 48-96 hours after online publication and is updated daily on week days.
Initial download of the metrics may take a while.