Free Access
Fig. 5.
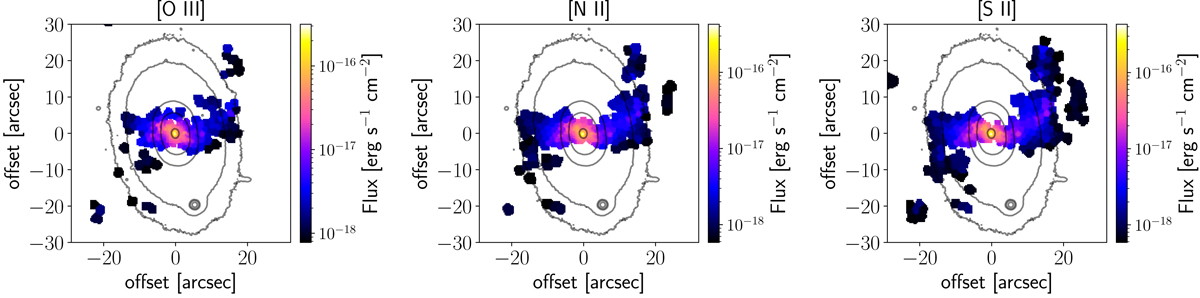
Flux maps for [O III], [N II], and [S II]. The figures only show regions where each of the lines was detected at an amplitude-to-noise ratio A/N > 5. The overlaid grey contours show the galaxy light isophotes. The orientation and scale is similar to that of Fig. 4.
Current usage metrics show cumulative count of Article Views (full-text article views including HTML views, PDF and ePub downloads, according to the available data) and Abstracts Views on Vision4Press platform.
Data correspond to usage on the plateform after 2015. The current usage metrics is available 48-96 hours after online publication and is updated daily on week days.
Initial download of the metrics may take a while.