Fig. 4.
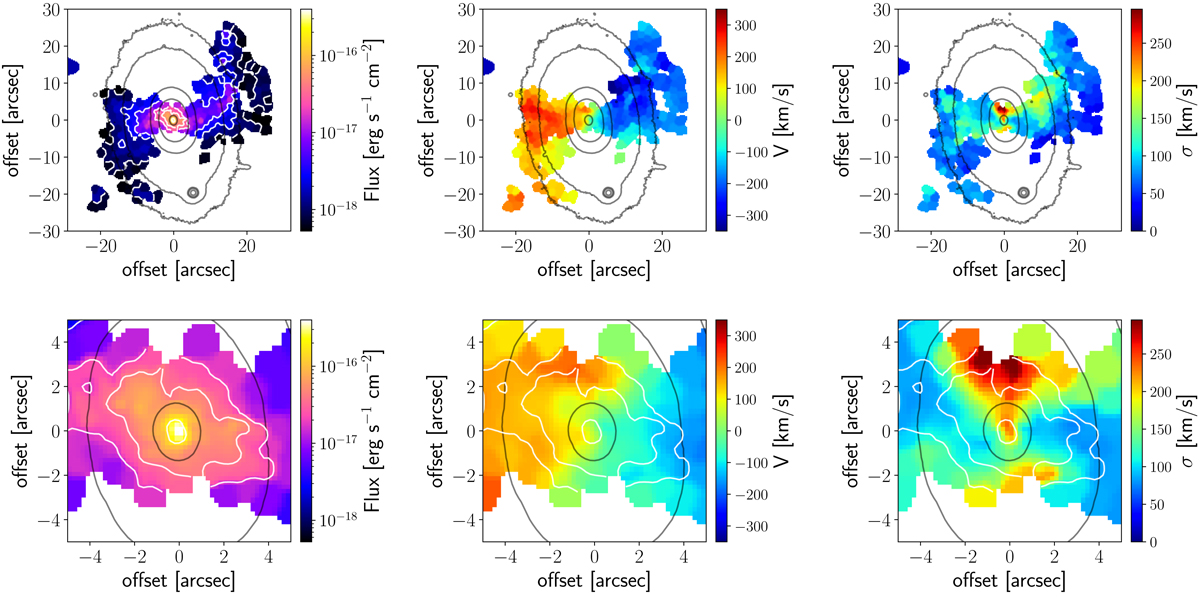
Maps of ionised gas distribution and dynamics based on the Hα narrow emission. Top panels: full field of view and bottom panels a zoom-in of the inner 10 × 10 arcsec2; 10 arcsec corresponds to 2.2 kpc. From left to right: Hα flux, velocity, and velocity dispersion. The flux value is per spatial pixel (0.2 × 0.2 arcsec2). The overlaid grey contours show the galaxy light isophotes, and the white contours are Hα flux contours. North is up, and east is left.
Current usage metrics show cumulative count of Article Views (full-text article views including HTML views, PDF and ePub downloads, according to the available data) and Abstracts Views on Vision4Press platform.
Data correspond to usage on the plateform after 2015. The current usage metrics is available 48-96 hours after online publication and is updated daily on week days.
Initial download of the metrics may take a while.