Fig. 2.
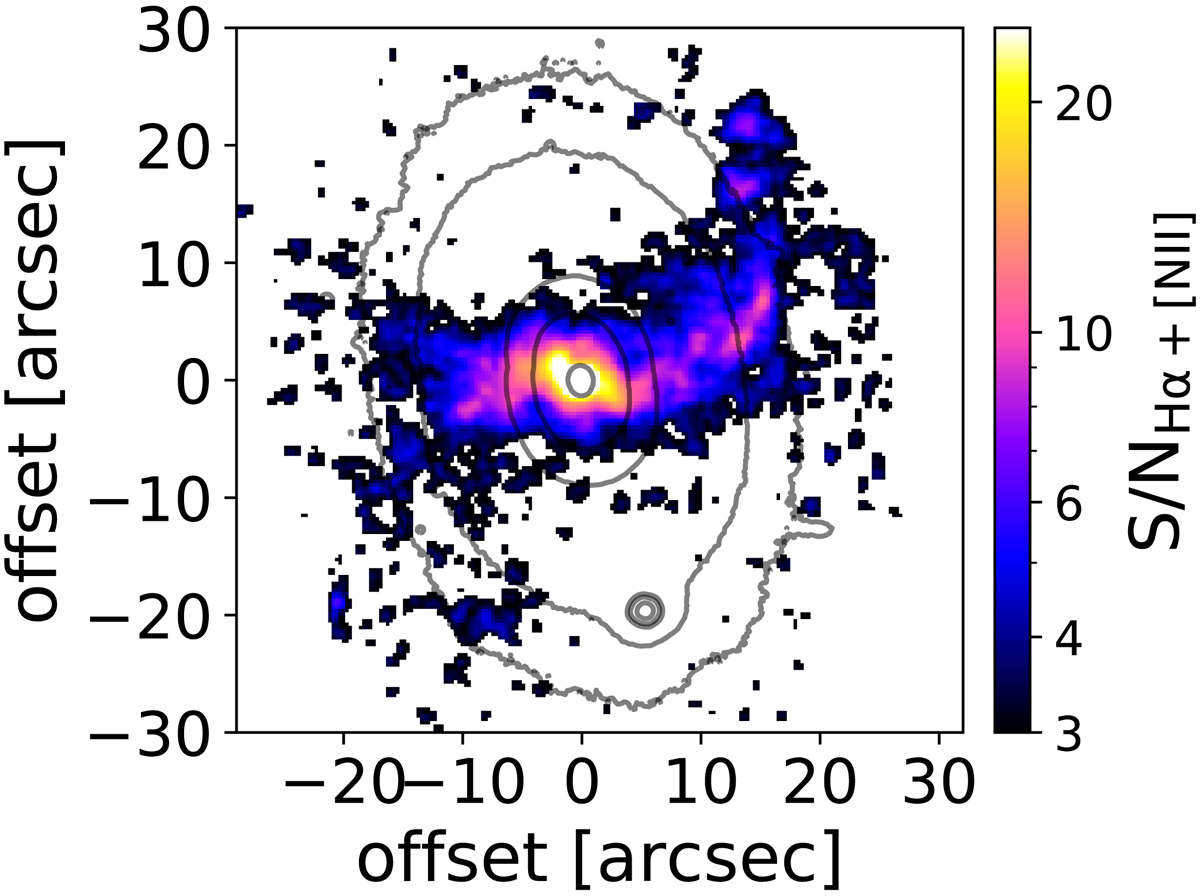
Map of the S/N per spatial pixel of the Hα+[N II] emission in logarithmic scale. The S/N refers to the integrated continuum-subtracted spectrum in the waveband of Hα+[N II] emission. The map illustrates the filamentary structure of the ionised gas distribution, with the contours showing the isophotes of integrated light from Fig. 1. North is up, and east is left.
Current usage metrics show cumulative count of Article Views (full-text article views including HTML views, PDF and ePub downloads, according to the available data) and Abstracts Views on Vision4Press platform.
Data correspond to usage on the plateform after 2015. The current usage metrics is available 48-96 hours after online publication and is updated daily on week days.
Initial download of the metrics may take a while.