Fig. 13.
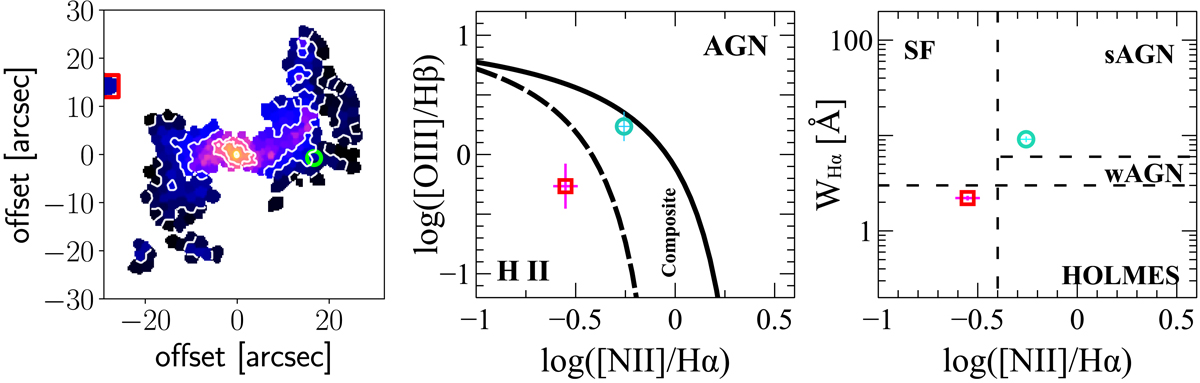
Line diagnostics for two regions of NGC 5077: the Hα blob to the north-east and the X-ray point source west of the nucleus. Left panel: regions studied, superimposed on the Hα flux map of Fig. 4. The red square indicates the Hα blob and the cyan circle the X-ray point source. The lines and labels in the central and right panels are similar to those in Fig. 10. The Hα emission region matches the line ratios expected for a star-forming region, while the X-ray point source matches AGN excitation conditions.
Current usage metrics show cumulative count of Article Views (full-text article views including HTML views, PDF and ePub downloads, according to the available data) and Abstracts Views on Vision4Press platform.
Data correspond to usage on the plateform after 2015. The current usage metrics is available 48-96 hours after online publication and is updated daily on week days.
Initial download of the metrics may take a while.