Fig. 8.
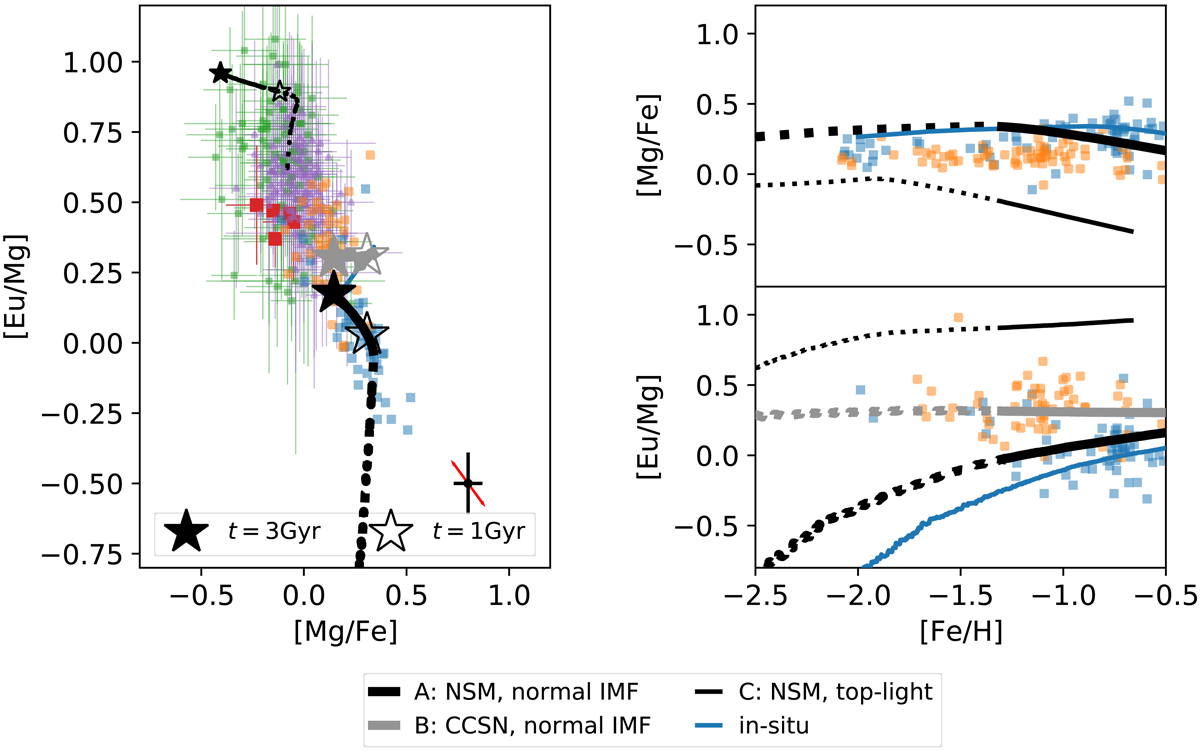
Left: [Eu/Mg] and [Mg/Fe] of stars with [Fe/H] > −1.3. Symbols follow Fig. 5 (for in situ and Gaia-Enceladus stars) and Fig. 7 (for LMC, Sagittarius, and Fornax). One-zone chemical evolution models are shown with the thick black line (baseline model A: Eu from NSMs with the standard Chabrier IMF), with the thick gray line (model B: a constant delay time for r-process enrichments, which represents the scenario that Eu is produced by CCSNe), and with the thin black line (model C: top-light IMF). Models are shown with solid lines for [Fe/H] > −1.3 and dashed line for −2.5 < [Fe/H]< − 1.3. Typical uncertainties in GALAH DR3 are shown in the bottom right. The red arrows indicate how stars move in this figure because of the uncertainties in [Mg/Fe]. Right: same chemical evolution models, but as a function of [Fe/H]. The blue solid line shows the baseline model A but shifted to higher metallicity by 0.5 dex to present a track that mimics the fast chemical evolution of in situ stars. The in situ model completely overlaps in the left panel and model B completely overlaps with the baseline model A in the [Mg/Fe]−[Fe/H] panel.
Current usage metrics show cumulative count of Article Views (full-text article views including HTML views, PDF and ePub downloads, according to the available data) and Abstracts Views on Vision4Press platform.
Data correspond to usage on the plateform after 2015. The current usage metrics is available 48-96 hours after online publication and is updated daily on week days.
Initial download of the metrics may take a while.