Fig. 7.
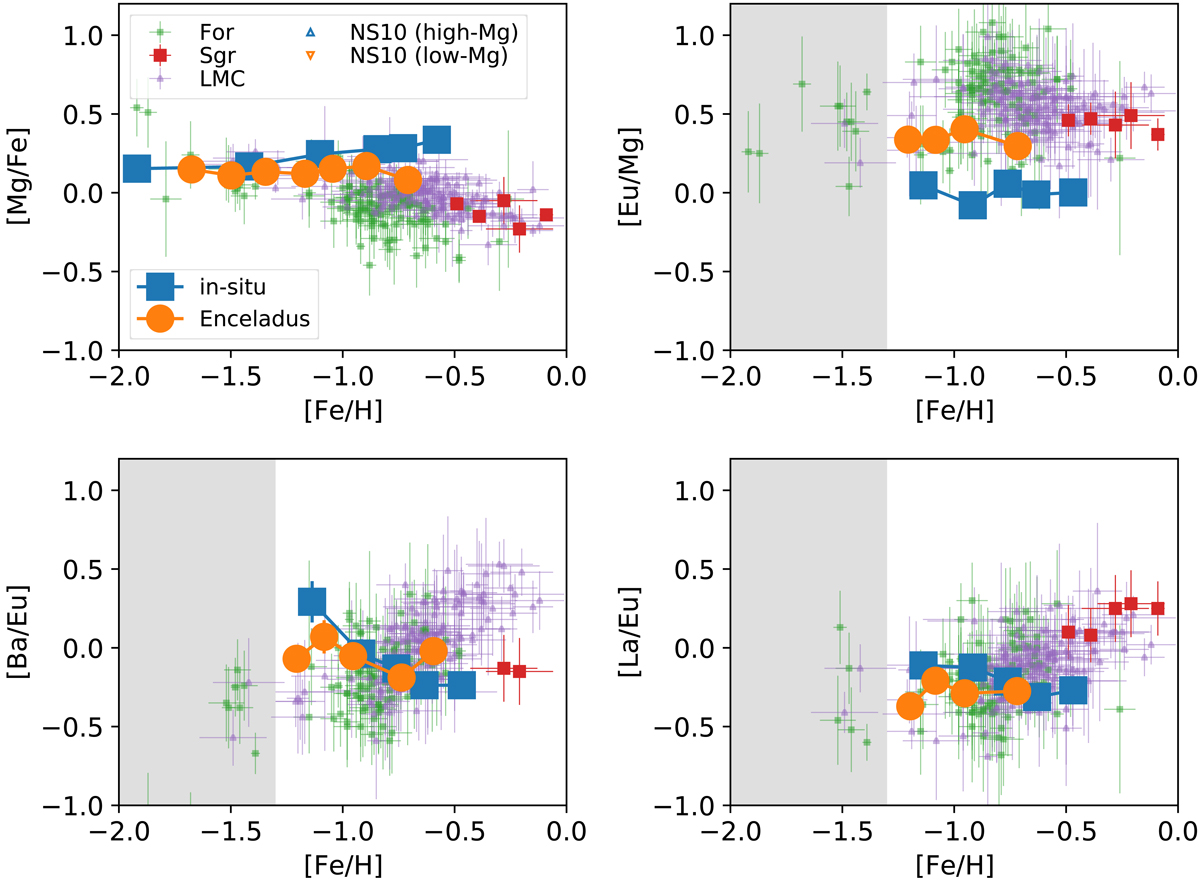
Abundance trends of Gaia-Enceladus and in situ stars in comparison with literature values. The GALAH data are binned in metallicity, and the weighted average values are plotted. The number of stars in each metallicity bin is between 5 and 33, and the error bars indicate the uncertainties in the estimated average estimated from the bootstrap sampling. The comparison sample is from Letarte et al. (2010) and Lemasle et al. (2014) for Fornax (values are corrected with the corrigendum Letarte et al. 2018), from Bonifacio et al. (2000) and McWilliam et al. (2013) for Sagittarius, and Van der Swaelmen et al. (2013) for LMC.
Current usage metrics show cumulative count of Article Views (full-text article views including HTML views, PDF and ePub downloads, according to the available data) and Abstracts Views on Vision4Press platform.
Data correspond to usage on the plateform after 2015. The current usage metrics is available 48-96 hours after online publication and is updated daily on week days.
Initial download of the metrics may take a while.