Fig. 5.
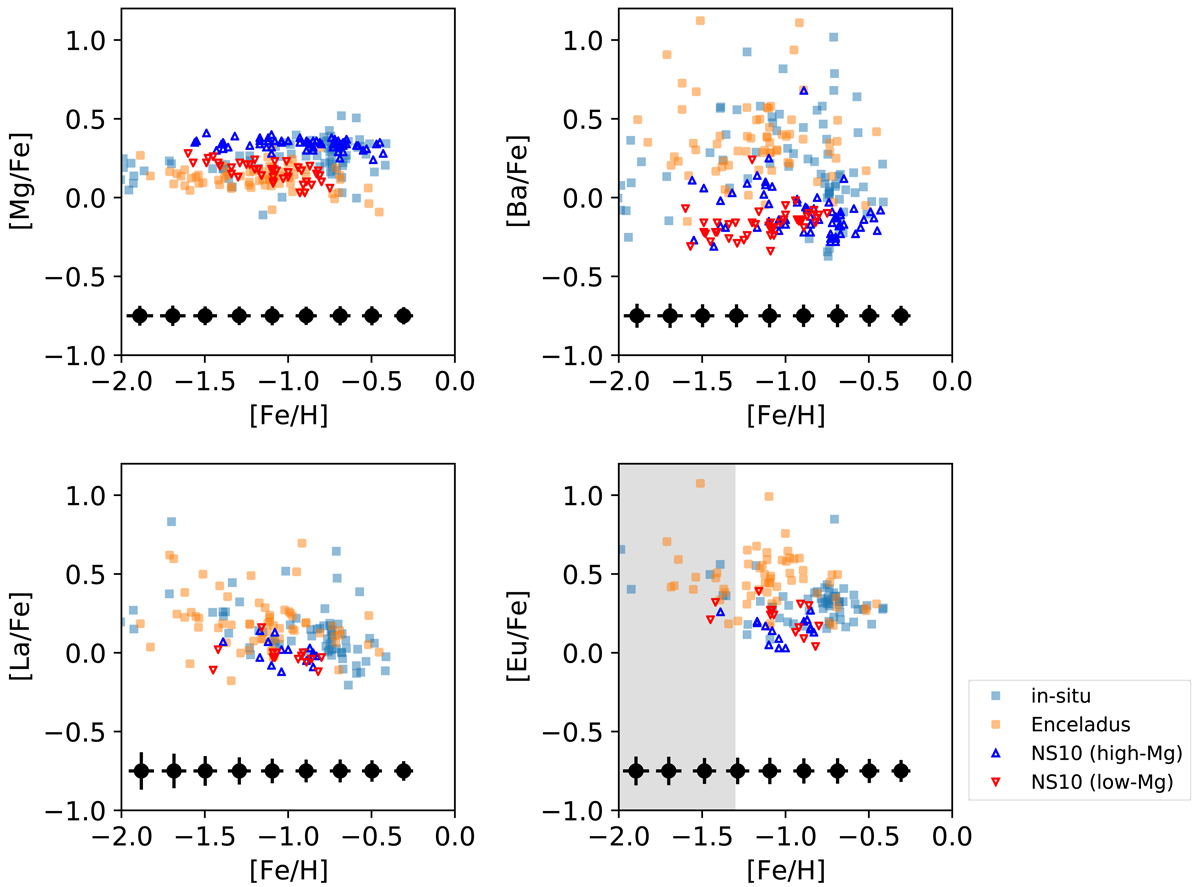
Chemical abundance ratios of Gaia-Enceladus and in situ stars in GALAH DR3. Typical uncertainties are shown as black symbols at the bottom. The gray shaded region indicates the metallicity range where the fraction of stars with Eu detection becomes small. The small blue and red triangles are respectively high-Mg and low-Mg populations from NS10, for which abundances are taken from NS10, NS11, and Fishlock et al. (2017).
Current usage metrics show cumulative count of Article Views (full-text article views including HTML views, PDF and ePub downloads, according to the available data) and Abstracts Views on Vision4Press platform.
Data correspond to usage on the plateform after 2015. The current usage metrics is available 48-96 hours after online publication and is updated daily on week days.
Initial download of the metrics may take a while.