Fig. 7.
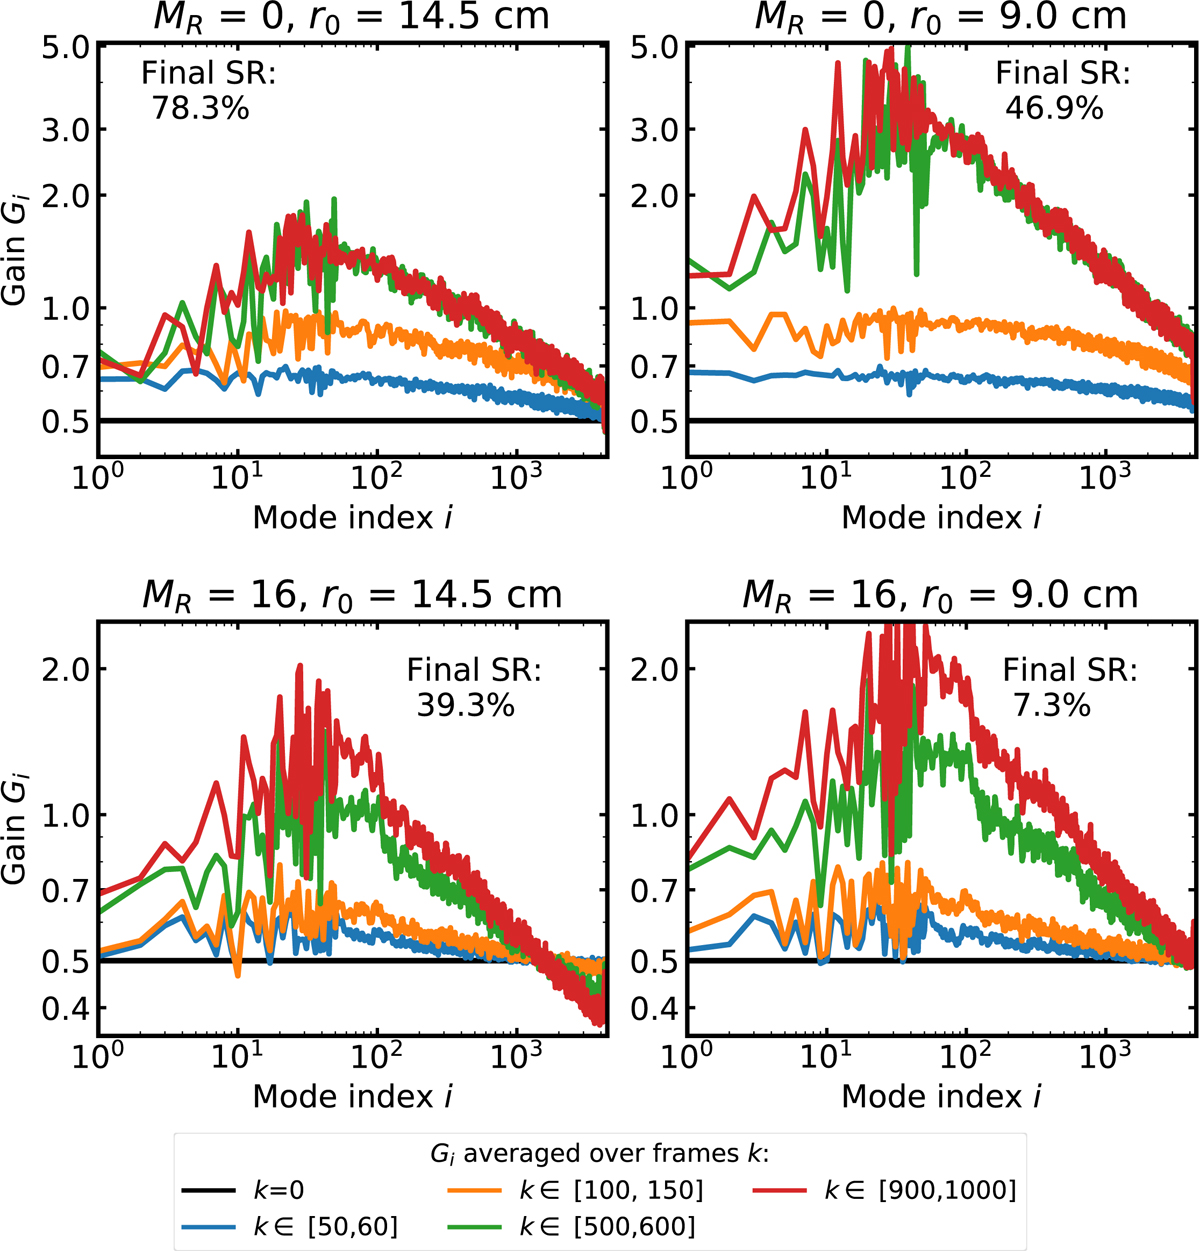
Convergence of CLOSE gains on the 2.0 s following closing of the AO loop for guide stars of MR = 0 and 16 and atmospheric r0 of 14.5 and 9.0 cm. All Gi are initialized to 0.5 at the start (blue line). Gi values are shown as averaged over the time windows given in the legend. Curves are smoothed along the i index for clarity. Final SRs are given in H band and are computed from the cumulative exposure over the last 200 ms (k ∈ [900, 1000]).
Current usage metrics show cumulative count of Article Views (full-text article views including HTML views, PDF and ePub downloads, according to the available data) and Abstracts Views on Vision4Press platform.
Data correspond to usage on the plateform after 2015. The current usage metrics is available 48-96 hours after online publication and is updated daily on week days.
Initial download of the metrics may take a while.