Fig. 7
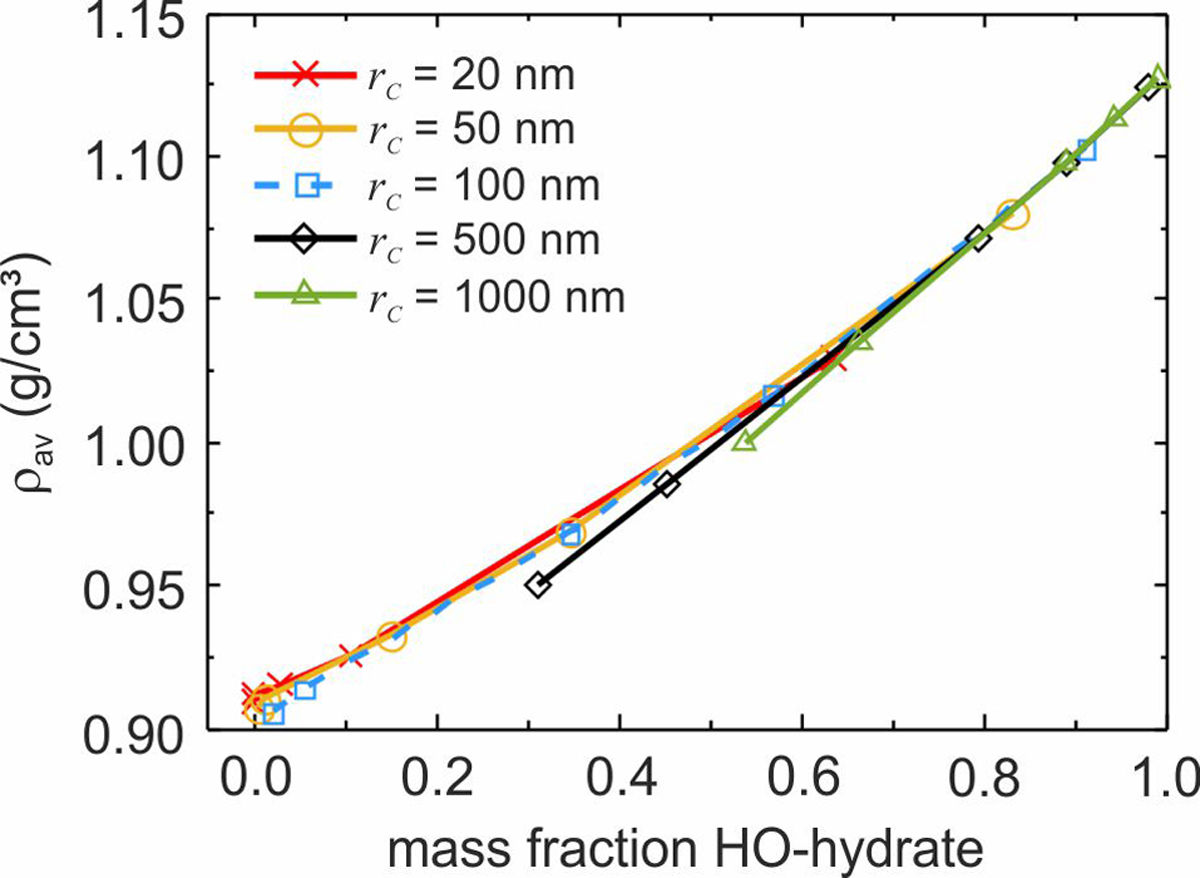
Graphof CO2 hydrate particle density as a function of high-occupancy-hydrate content in each particle. The five lines correspond to five different high-occupancy-core radii, rc = rh − dLO = 20, 50, 100, 500, and 1000 nm, with each point in each respective line representing the five scenarios of differing low-occupancy-hydrate thickness given in Cols. 1 and 2 of Table 2.
Current usage metrics show cumulative count of Article Views (full-text article views including HTML views, PDF and ePub downloads, according to the available data) and Abstracts Views on Vision4Press platform.
Data correspond to usage on the plateform after 2015. The current usage metrics is available 48-96 hours after online publication and is updated daily on week days.
Initial download of the metrics may take a while.