Fig. 5.
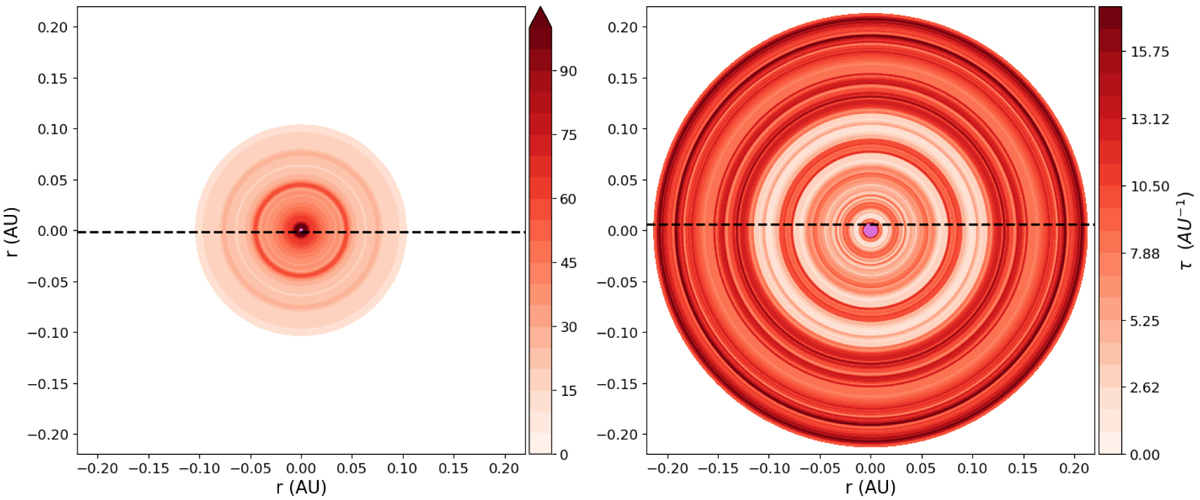
Radial distribution of twist in the cross-section of two MCs replicating Event 1 (left panel) and 2 (right panel) at 1 AU. The color bars represent the twist values and the dashed lines show the spacecraft propagation directions. The light purple dots at the center of the cross-sections indicate the portions for which twist values are not available.
Current usage metrics show cumulative count of Article Views (full-text article views including HTML views, PDF and ePub downloads, according to the available data) and Abstracts Views on Vision4Press platform.
Data correspond to usage on the plateform after 2015. The current usage metrics is available 48-96 hours after online publication and is updated daily on week days.
Initial download of the metrics may take a while.