Fig. 1.
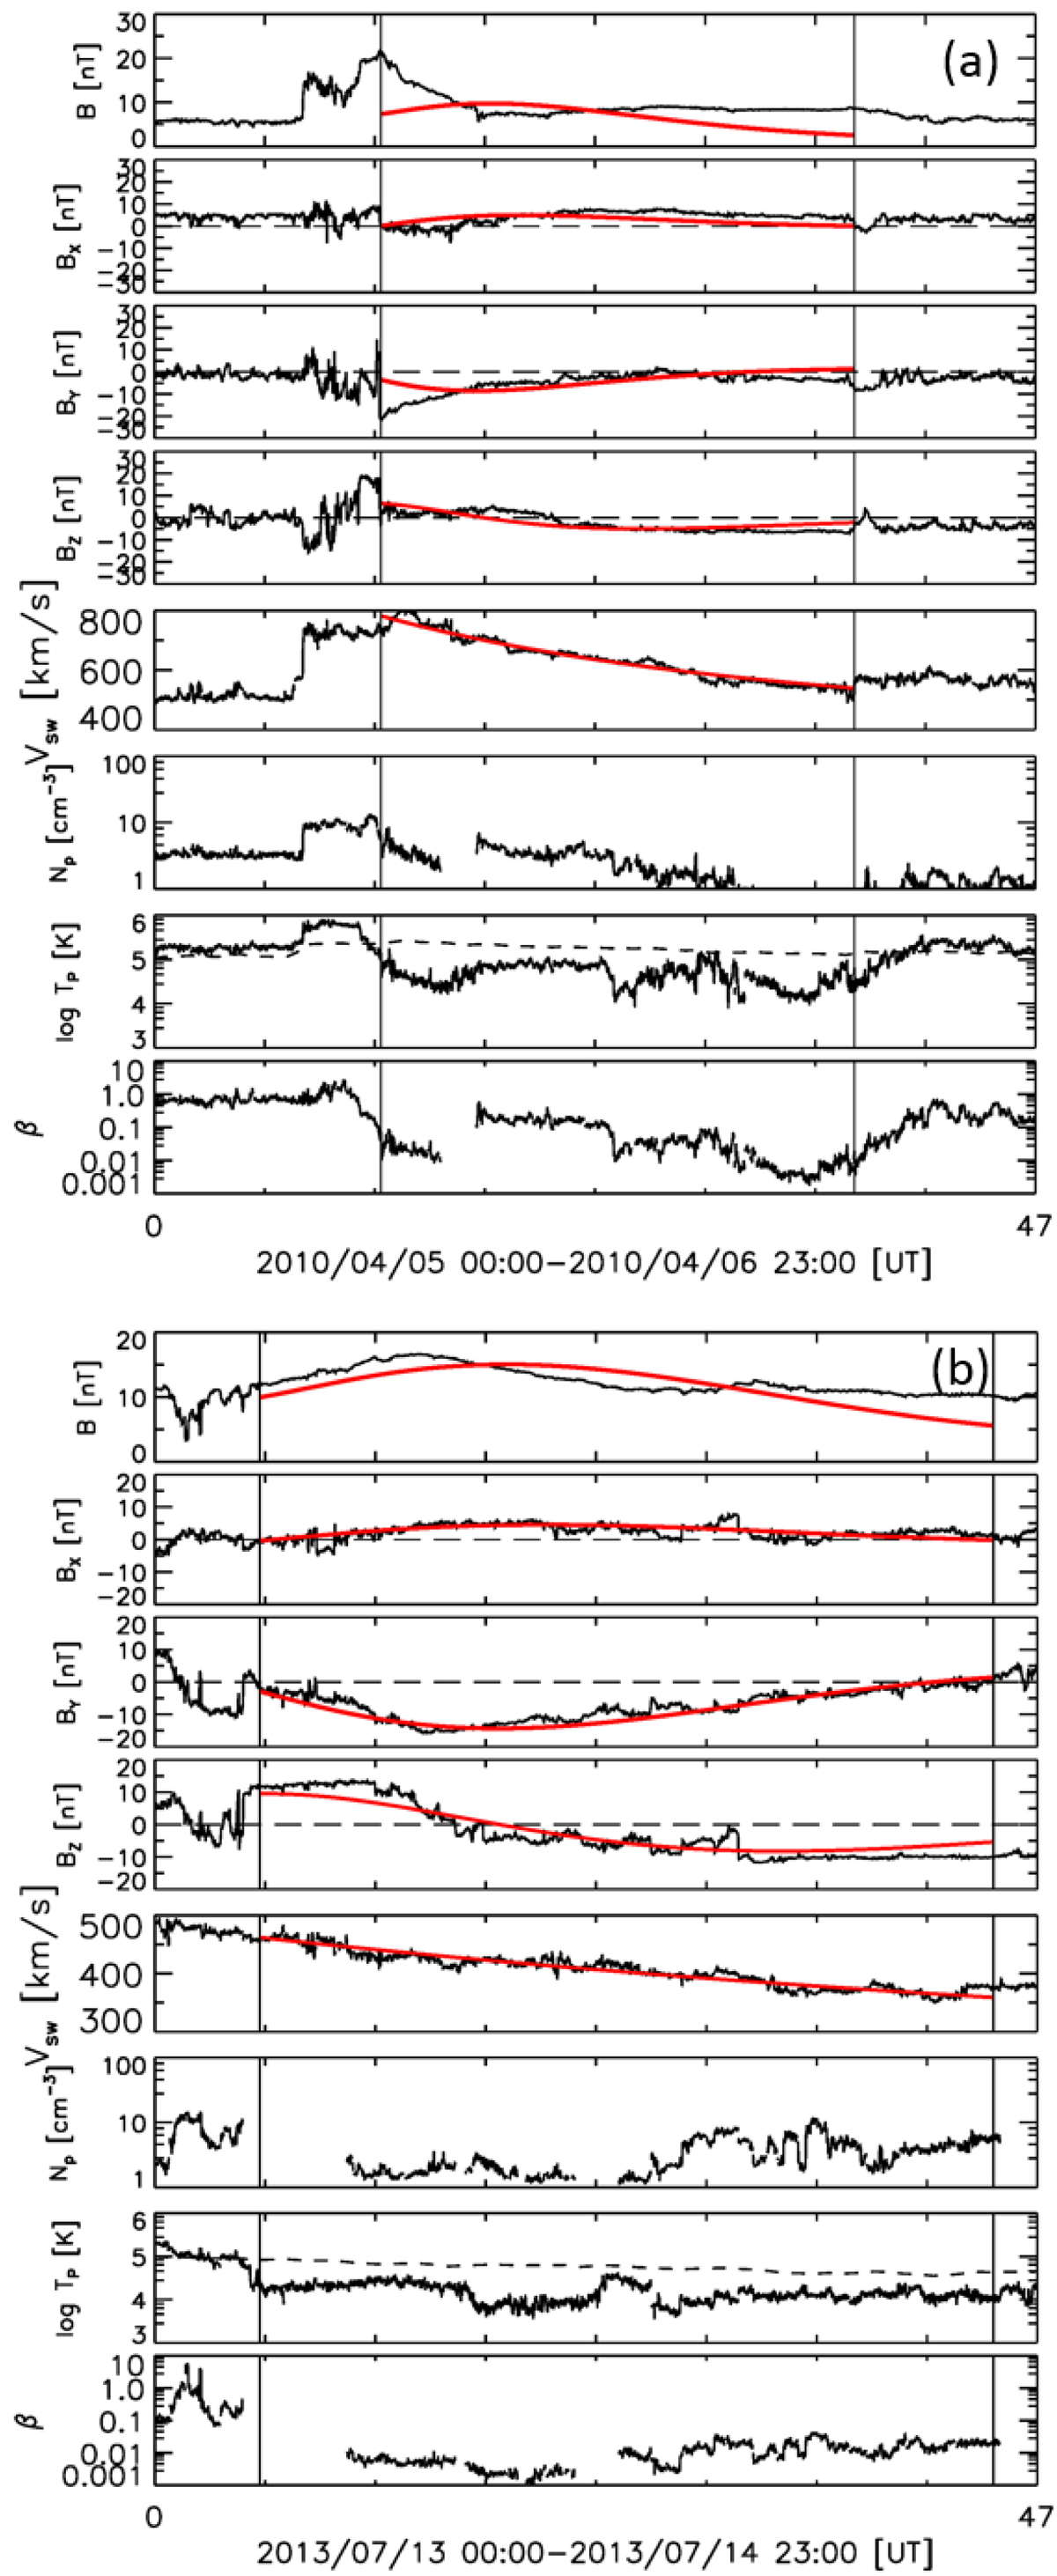
Observations of MCs associated with (a) Event 1 and (b) Event 2 measured by the ACE spacecraft. From top to bottom, the panels: magnetic field intensity B; the three magnetic field components Bx, By, and Bz in GSE coordinates; plasma velocity Vsw; proton density Np; temperature Tp; and plasma-β. The dashed curves plotted over Tp represent Tex. The vertical black lines indicate the start and end times of the MCs. Time is given (in hours) on the x-axes; the times in UT corresponding to the zero-hour times are indicated below the axes.
Current usage metrics show cumulative count of Article Views (full-text article views including HTML views, PDF and ePub downloads, according to the available data) and Abstracts Views on Vision4Press platform.
Data correspond to usage on the plateform after 2015. The current usage metrics is available 48-96 hours after online publication and is updated daily on week days.
Initial download of the metrics may take a while.