Fig. 2.
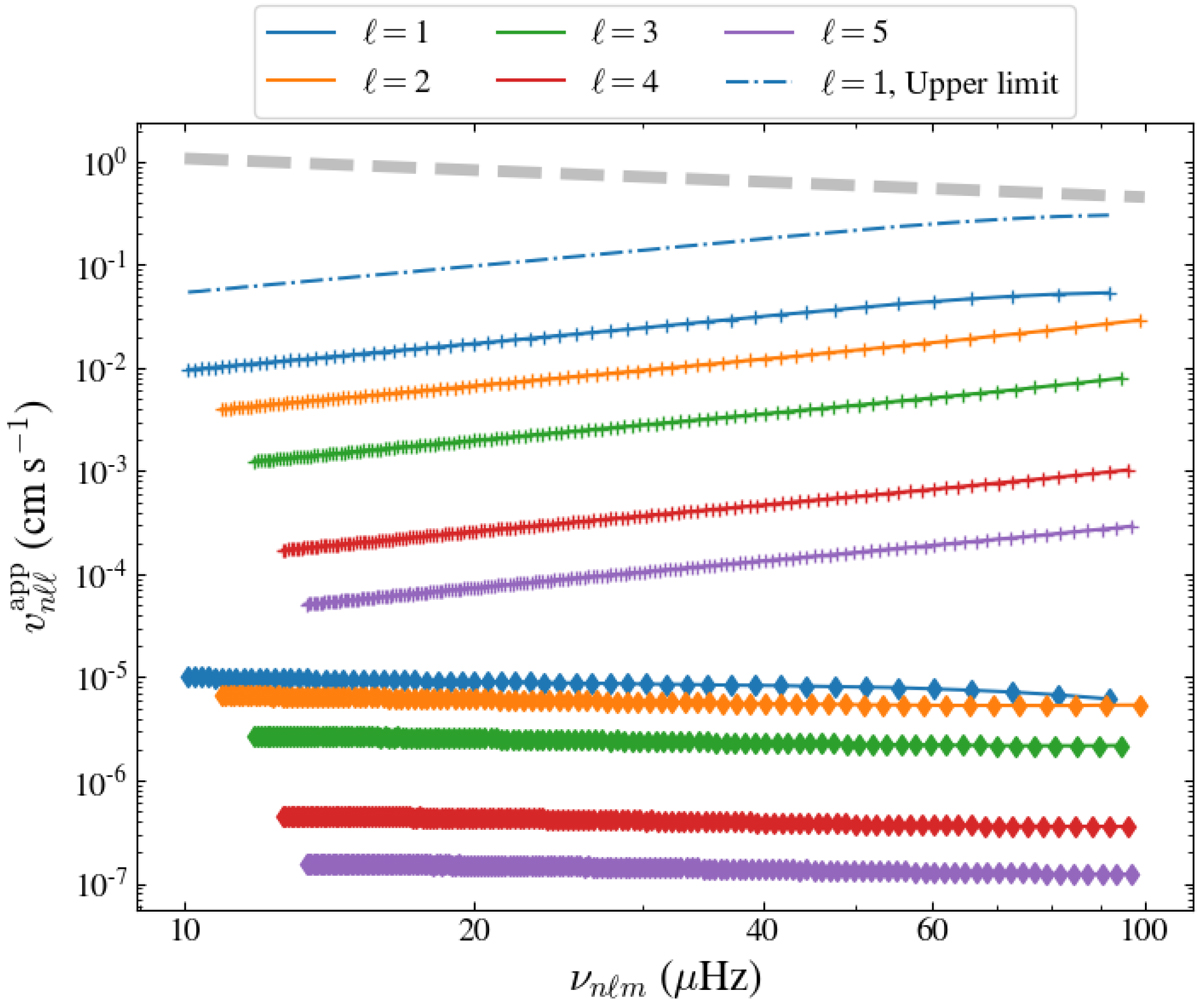
Apparent surface radial velocity of solar gravity modes as a function of the oscillation frequency νnℓm and the angular degree ℓ, for azimuthal numbers m = ℓ and for standard plume parameters. The results obtained with a Gaussian and an exponential plume time evolution (see Sect. 2.3) are represented by the diamonds and the plus signs, respectively, for each considered eigenmode. The thick dashed gray line corresponds to the 22-year GOLF detection threshold (see Sect. 3.3). The blue dash-dotted line represents the upper limit for the amplitude of the dipolar modes when accounting for the largest plausible variations in the plume parameters (i.e., with a factor of two increase in the inverse plume lifetime and radius; see Sect. 4.3).
Current usage metrics show cumulative count of Article Views (full-text article views including HTML views, PDF and ePub downloads, according to the available data) and Abstracts Views on Vision4Press platform.
Data correspond to usage on the plateform after 2015. The current usage metrics is available 48-96 hours after online publication and is updated daily on week days.
Initial download of the metrics may take a while.