Fig. 5.
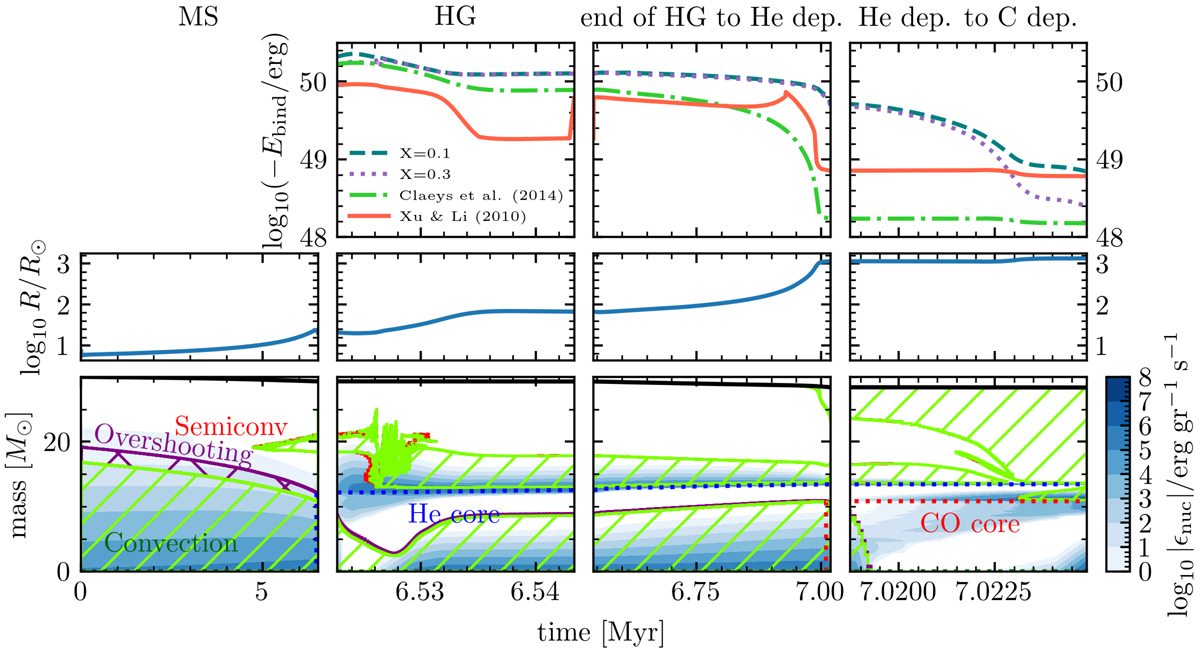
Kippenhahn diagram for our default 30 M⊙ model, separating different evolutionary stages as well as showing the evolution of the stellar radii. “He dep.” and “C dep.” stand for core helium and carbon depletion respectively. In addition, we show the result of computing Ebind under the assumption that the core–envelope boundary Mcore at which CE would finish is at the innermost mass coordinates where the hydrogen mass fraction is X = 0.1 or X = 0.3. We only show Ebind after the formation of the helium core, so no information is given on the main sequence. To provide a comparison point to rapid population synthesis codes, we also show the resulting Ebind from the fits of Claeys et al. (2014) and Xu & Li (2010).
Current usage metrics show cumulative count of Article Views (full-text article views including HTML views, PDF and ePub downloads, according to the available data) and Abstracts Views on Vision4Press platform.
Data correspond to usage on the plateform after 2015. The current usage metrics is available 48-96 hours after online publication and is updated daily on week days.
Initial download of the metrics may take a while.