Free Access
Fig. D.1.
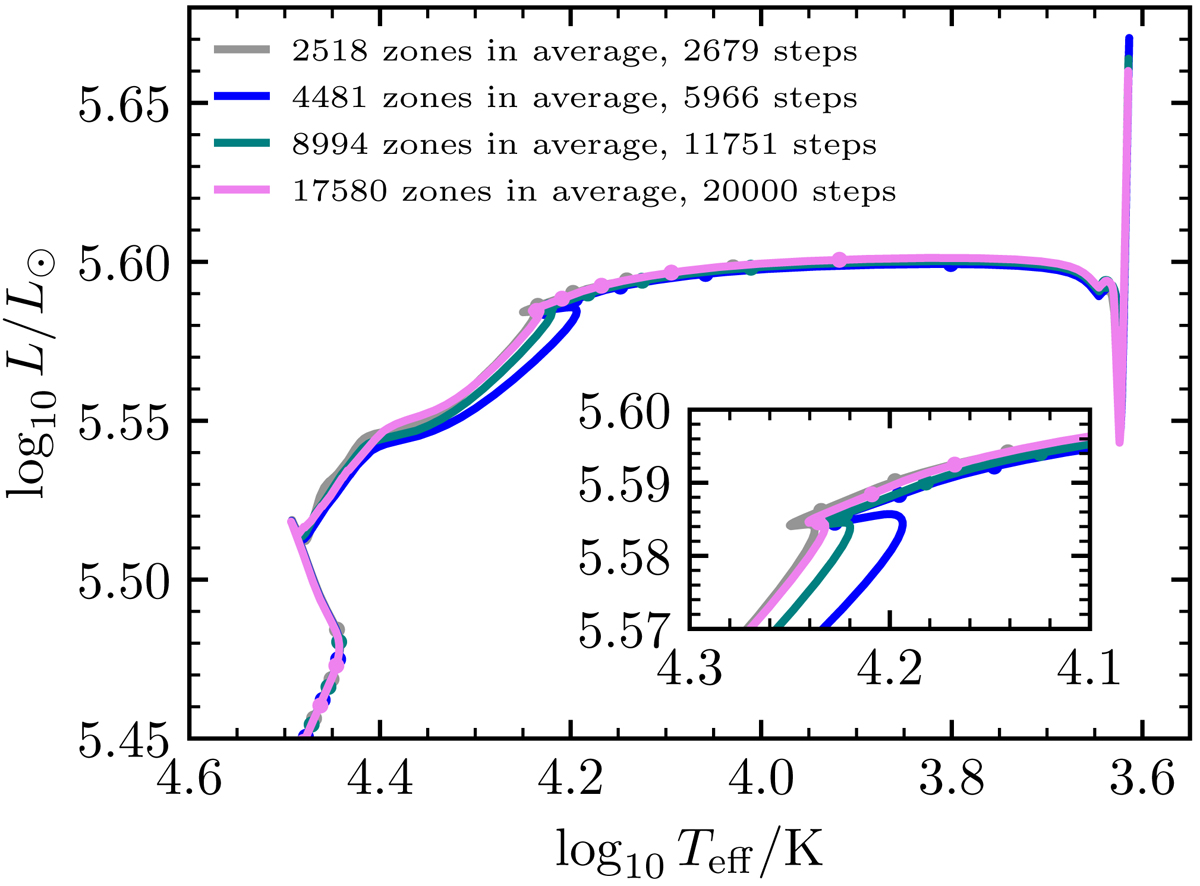
Evolution in the HR diagram of a single 30 M⊙ model with a metallicity of Z⊙/10 computed with increasing spatial and temporal resolution. For each track, we indicate the average number of zones in the model as well as the steps taken in the simulation. The lowest resolution track shown corresponds to our default setup.
Current usage metrics show cumulative count of Article Views (full-text article views including HTML views, PDF and ePub downloads, according to the available data) and Abstracts Views on Vision4Press platform.
Data correspond to usage on the plateform after 2015. The current usage metrics is available 48-96 hours after online publication and is updated daily on week days.
Initial download of the metrics may take a while.