Free Access
Fig. 16.
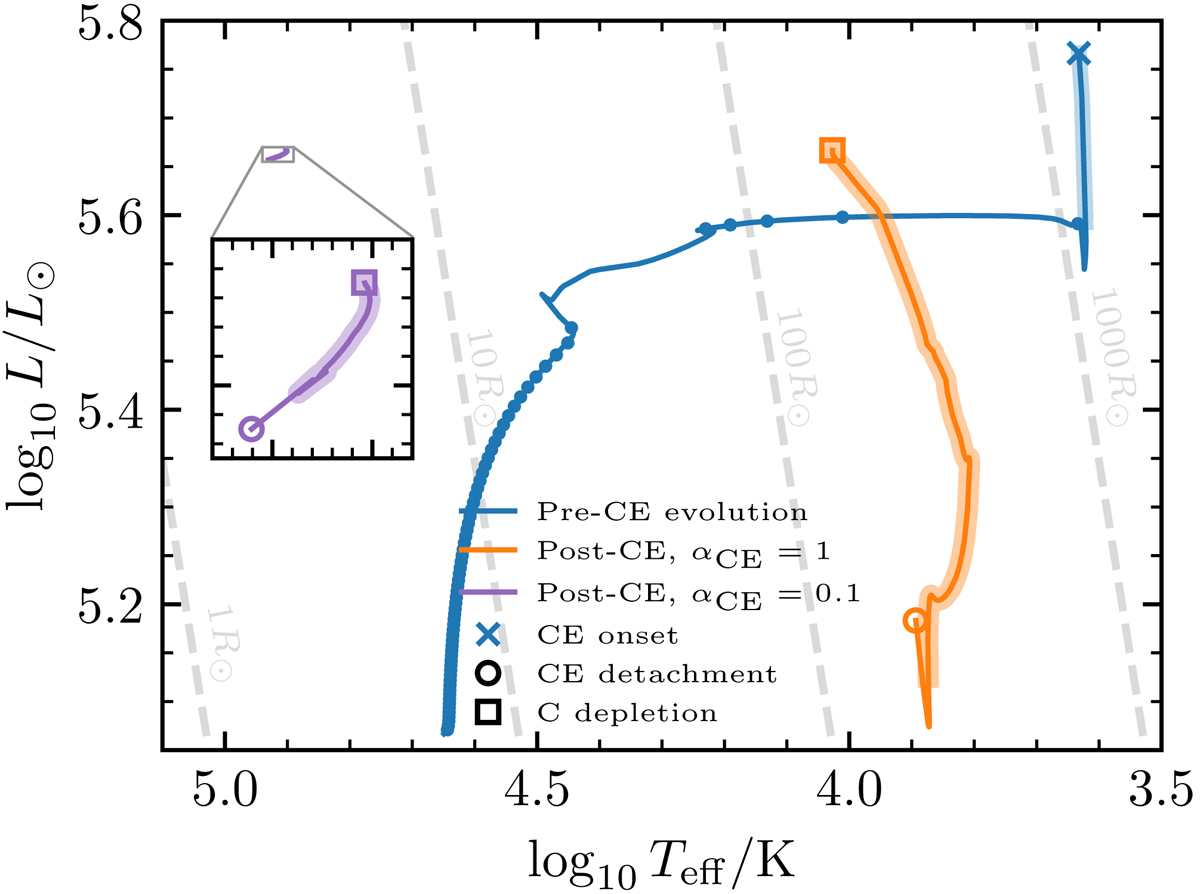
HR diagram showing the evolution of a system undergoing CE evolution composed of a 30 M⊙ donor with a 14.1 M⊙ BH companion at an initial period of 2344 days. Results are shown for two values of the efficiency of CE evolution, αCE = 1 and αCE = 0.1, with the evolution prior to CE being identical.
Current usage metrics show cumulative count of Article Views (full-text article views including HTML views, PDF and ePub downloads, according to the available data) and Abstracts Views on Vision4Press platform.
Data correspond to usage on the plateform after 2015. The current usage metrics is available 48-96 hours after online publication and is updated daily on week days.
Initial download of the metrics may take a while.